Dell 1998 Annual Report Download - page 37
Download and view the complete annual report
Please find page 37 of the 1998 Dell annual report below. You can navigate through the pages in the report by either clicking on the pages listed below, or by using the keyword search tool below to find specific information within the annual report.-
 1
1 -
2
-
3
-
4
-
5
-
6
-
7
-
8
-
9
-
10
-
11
-
12
-
13
-
14
-
15
-
16
-
17
-
18
-
19
-
20
-
21
-
22
-
23
-
24
-
25
-
26
-
 27
27 -
 28
28 -
 29
29 -
 30
30 -
 31
31 -
 32
32 -
 33
33 -
 34
34 -
 35
35 -
 36
36 -
 37
37 -
 38
38 -
 39
39 -
 40
40 -
 41
41 -
 42
42 -
 43
43 -
 44
44 -
 45
45 -
 46
46 -
 47
47 -
48
-
49
-
50
 |
 |
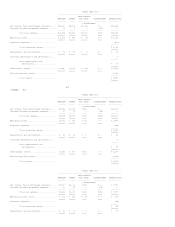
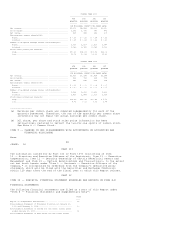
FISCAL YEAR 1999
-------------------------------------
4TH 3RD 2ND 1ST
QUARTER QUARTER QUARTER QUARTER
------- ------- ------- -------
(IN MILLIONS, EXCEPT PER SHARE DATA)
Net revenue............................................. $5,173 $4,818 $4,331 $3,920
Gross margin............................................ 1,161 1,086 985 873
Net income.............................................. 425 384 346 305
Earnings per common share(a)(b):
Basic................................................. $ 0.17 $ 0.15 $ 0.14 $ 0.12
Diluted............................................... $ 0.15 $ 0.14 $ 0.12 $ 0.11
Number of weighted average shares outstanding(b):
Basic................................................. 2,527 2,527 2,529 2,547
Diluted............................................... 2,749 2,762 2,785 2,799
Stock sales prices per share(b):
High.................................................. $50.19 $34.63 $29.56 $21.06
Low................................................... 29.78 20.38 19.31 12.61
FISCAL YEAR 1998
-------------------------------------
4TH 3RD 2ND 1ST
QUARTER QUARTER QUARTER QUARTER
------- ------- ------- -------
(IN MILLIONS, EXCEPT PER SHARE DATA)
Net revenue............................................. $3,737 $3,188 $2,814 $2,588
Gross margin............................................ 822 718 624 558
Net income.............................................. 285 248 214 198
Earnings per common share(a)(b):
Basic................................................. $ 0.11 $ 0.09 $ 0.08 $ 0.07
Diluted............................................... $ 0.10 $ 0.09 $ 0.07 $ 0.07
Number of weighted average shares outstanding(b):
Basic................................................. 2,564 2,613 2,652 2,699
Diluted............................................... 2,823 2,884 2,915 2,937
Stock sales prices per share(b):
High.................................................. $12.63 $12.98 $10.84 $ 5.75
Low................................................... 8.75 9.13 5.53 3.74
---------------
(a) Earnings per common share are computed independently for each of the
quarters presented. Therefore, the sum of the quarterly per common share
information may not equal the annual earnings per common share.
(b) All share, per share and stock sales price information has been
retroactively restated to reflect the two-for-one splits of common stock.
See Note 6 -- Common Stock.
ITEM 9 -- CHANGES IN AND DISAGREEMENTS WITH ACCOUNTANTS ON ACCOUNTING AND
FINANCIAL DISCLOSURE
None.
48
<PAGE> 50
PART III
The information called for by Part III of Form 10-K (consisting of Item
10 -- Directors and Executive Officers of the Registrant, Item 11 -- Executive
Compensation, Item 12 -- Security Ownership of Certain Beneficial Owners and
Management and Item 13 -- Certain Relationships and Transactions), to the extent
not set forth herein under "Item 1 -- Business -- Executive Officers of the
Company," is incorporated by reference from the Company's definitive proxy
statement, which will be filed with the Securities and Exchange Commission
within 120 days after the end of the fiscal year to which this Report relates.
PART IV
ITEM 14 -- EXHIBITS, FINANCIAL STATEMENT SCHEDULES AND REPORTS ON FORM 8-K
FINANCIAL STATEMENTS
The following financial statements are filed as a part of this Report under
"Item 8 -- Financial Statements and Supplementary Data":
PAGE
----
Report of Independent Accountants........................... 29
Consolidated Statement of Financial Position at January 29,
1999 and February 1, 1998................................. 30
Consolidated Statement of Income for the three fiscal years
ended January 29, 1999.................................... 31
Consolidated Statement of Cash Flows for the three fiscal