DSW 2011 Annual Report Download - page 21
Download and view the complete annual report
Please find page 21 of the 2011 DSW annual report below. You can navigate through the pages in the report by either clicking on the pages listed below, or by using the keyword search tool below to find specific information within the annual report.-
 1
1 -
2
-
3
-
4
-
5
-
6
-
7
-
8
-
9
-
10
-
 11
11 -
 12
12 -
 13
13 -
 14
14 -
 15
15 -
 16
16 -
 17
17 -
 18
18 -
 19
19 -
 20
20 -
 21
21 -
 22
22 -
 23
23 -
 24
24 -
 25
25 -
 26
26 -
 27
27 -
 28
28 -
 29
29 -
 30
30 -
 31
31 -
32
-
33
-
34
-
35
-
36
-
37
-
38
-
39
-
40
-
41
-
42
-
43
-
44
-
45
-
46
-
47
-
48
-
49
-
50
-
51
-
52
-
53
-
54
-
55
-
56
-
57
-
58
-
59
-
60
-
61
-
62
-
63
-
64
-
65
-
66
-
67
-
68
-
69
-
70
-
71
-
72
-
73
-
74
-
75
-
76
-
77
-
78
-
79
-
80
-
81
-
82
-
83
-
84
-
85
-
86
-
87
-
88
-
89
-
90
-
91
-
92
-
93
-
94
-
95
-
96
-
97
-
98
-
99
-
100
-
101
-
102
-
103
-
104
-
105
-
106
-
107
-
108
-
109
-
110
-
111
-
112
-
113
-
114
-
115
-
116
-
117
-
118
-
119
-
120
 |
 |

Table of Contents
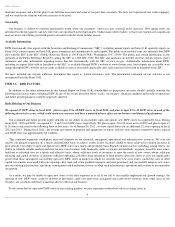
Performance Graph
The following graph compares our cumulative total shareholder return of our Class A Common Shares with the cumulative total return of the S&P
MidCap 400 Index and the S&P Retailing Index, both of which are published indexes. This comparison includes the period ended
February 3, 2007
through the period ended January 28, 2012 .
The comparison of the cumulative total returns for each investment assumes $100 was invested on February 3, 2007
and that all dividends were
reinvested.
16
Total number of shares
withheld
Average price paid per
share
Total number of shares
purchased as part of
publicly announced
programs
Approximate dollar
value of shares that
may yet be purchased
under the programs
October 30, 2011 to November 26, 2011
November 27, 2011 to December 31, 2011
2
$
42.97
January 1, 2012 to January 28, 2012
2
$
42.97
Fiscal years ended
Company / Index
2/3/2007
2/2/2008
1/31/2009
1/30/2010
1/29/2011
1/28/2012
DSW Inc.
$
100.00
$
46.05
$
24.89
$
60.11
$
83.04
$
130.82
S&P MidCap 400 Index
100.00
97.77
61.62
88.34
117.91
121.10
S&P Retailing Index
100.00
81.62
47.31
90.10
122.48
146.86