D-Link 2010 Annual Report Download - page 2
Download and view the complete annual report
Please find page 2 of the 2010 D-Link annual report below. You can navigate through the pages in the report by either clicking on the pages listed below, or by using the keyword search tool below to find specific information within the annual report.-
 1
1 -
 2
2 -
 3
3 -
 4
4 -
 5
5 -
 6
6 -
 7
7 -
 8
8 -
 9
9 -
 10
10 -
 11
11 -
 12
12 -
 13
13 -
14
-
15
-
16
-
17
-
18
-
19
-
20
-
21
-
22
-
23
 |
 |

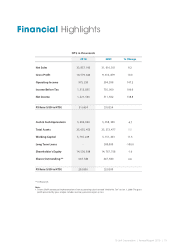
Financial Highlights
Cash & Cash Equivalents
Total Assets
Working Capital
Long Term Loans
Shareholder’s Equity
Shares Outstanding **
FX Rate (USD to NTD)
Net Sales
Gross Profit
Operating Income
Income Before Tax
Net Income
FX Rate (USD to NTD)
NT$ in thousands
20092010 % Change
31, 016, 351
9, 616, 879
394, 598
735, 000
511, 562
33.0554
33, 857, 100
10, 579, 642
975, 250
1, 513, 855
1, 221, 566
31.6654
9.2
10.0
147.2
106.0
138.8
5, 558, 349
25, 372, 477
5, 151, 403
500,000
14, 767, 758
647, 580
32.0300
5, 296, 920
25, 655, 452
5, 735, 229
-
14, 530, 928
647, 580
29.0300
-4.7
1.1
11.3
-100.0
-1.6
0.0
** in thousands
Note:
1. Taiwan GAAP announced implementation of new accounting criteria named "Article No. Ten" on Jan. 1, 2009. The gross
prot presented by gross margin includes inventory provisional gain or loss.
D-Link Corporation | Annual Report 2010 | 01