Creative 2014 Annual Report Download - page 5
Download and view the complete annual report
Please find page 5 of the 2014 Creative annual report below. You can navigate through the pages in the report by either clicking on the pages listed below, or by using the keyword search tool below to find specific information within the annual report.-
 1
1 -
 2
2 -
 3
3 -
 4
4 -
 5
5 -
 6
6 -
 7
7 -
 8
8 -
 9
9 -
 10
10 -
 11
11 -
 12
12 -
 13
13 -
 14
14 -
 15
15 -
 16
16 -
17
-
18
-
19
-
20
-
21
-
22
-
23
-
24
-
25
-
26
-
27
-
28
-
29
-
30
-
31
-
32
-
33
-
34
-
35
-
36
-
37
-
38
-
39
-
40
-
41
-
42
-
43
-
44
-
45
-
46
-
47
-
48
-
49
-
50
-
51
-
52
-
53
-
54
-
55
-
56
-
57
-
58
-
59
-
60
-
61
-
62
-
63
-
64
 |
 |

5
CREATIVE TECHNOLOGY LTD AND ITS SUBSIDIARIES
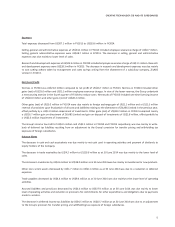
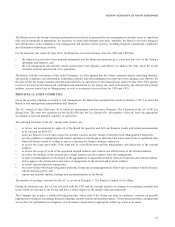
Expenses
Total expenses decreased from US$67.1 million in FY2013 to US$59.6 million in FY2014.
Selling, general and administrave expenses at US$34.1 million in FY2014 included employee severance charge of US$0.7 million.
Selling, general administrave expenses were US$38.7 million in FY2013. The decrease in selling, general and administrave
expenses was due mainly to lower level of sales.
Research and development expenses at US$25.5 million in FY2014 included employee severance charge of US$1.1 million. Research
and development expenses were US$28.3 million in FY2013. The decrease in research and development expenses was due mainly
to cost cung acons taken by management and costs savings arising from the divestment of a subsidiary company, ZiiLABS
Limited in FY2013.
Net loss in FY2014 was US$21.8 million compared to net prot of US$16.7 million in FY2013. Net loss in FY2014 included other
gains (net) of US$3.0 million and US$2.2 million employee severance charges. In view of the lower revenue, the Group undertook
a restructuring exercise in the fourth quarter of FY2014 to reduce costs. Net results of FY2013 included one me licensing income
of US$20.0 million and other gains (net) of US$28.2 million.
Other gains (net) of US$3.0 million in FY2014 were due mainly to foreign exchange gain of US$2.2 million and a US$1.5 million
reversal of provisions upon nalisaoin of all costs and liabilies relang to the divestment of ZiiLABS Limited in the previous year,
oset parally by a US$1.0 million impairment of investments. Other gains (net) of US$28.2 million in FY2013 comprised mainly
a US$26.7 million gain on divestment of ZiiLABS Limited and gain on disposal of investments of US$2.8 million, oset parally by
a US$2.3 million impairment of investments.
The Group’s income tax credit of US$4.5 million and US$2.5 million in FY2014 and FY2013 respecvely, was due mainly to write-
back of deferred tax liabilies resulng from an adjustment to the Group’s provision for transfer pricing and withholding tax
exposure of foreign subsidiaries.
Balance Sheet
The decrease in cash and cash equivalents was due mainly to net cash used in operang acvies and payment of dividends to
equity holders of the Company.
The decrease in trade receivables by US$4.2 million to US$10.6 million as at 30 June 2014 was due mainly to the lower level of
sales.
The increase in inventories by US$3.6 million to US$28.9 million as at 30 June 2014 was due mainly to inventories for new products.
Other non-current assets decreased by US$1.7 million to US$0.1 million as at 30 June 2014 was due to a reducon in deferred
expenses.
Trade payables decreased by US$4.4 million to US$9.4 million as at 30 June 2014 was due mainly to the lower level of operang
acvies.
Accrued liabilies and provisions decreased by US$6.6 million to US$37.9 million as at 30 June 2014 was due mainly to lower
level of operang acvies and reducon in provisions for commitments for other expenditures and obligaons due to payments
made to vendors.
The decrease in deferred income tax liabilies by US$4.5 million to US$10.7 million as at 30 June 2014 was due to an adjustment
to the Group’s provision for transfer pricing and withholding tax exposure of foreign subsidiaries.