Creative 2014 Annual Report Download - page 4
Download and view the complete annual report
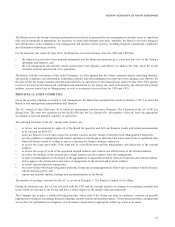
Please find page 4 of the 2014 Creative annual report below. You can navigate through the pages in the report by either clicking on the pages listed below, or by using the keyword search tool below to find specific information within the annual report.-
 1
1 -
 2
2 -
 3
3 -
 4
4 -
 5
5 -
 6
6 -
 7
7 -
 8
8 -
 9
9 -
 10
10 -
 11
11 -
 12
12 -
 13
13 -
 14
14 -
 15
15 -
16
-
17
-
18
-
19
-
20
-
21
-
22
-
23
-
24
-
25
-
26
-
27
-
28
-
29
-
30
-
31
-
32
-
33
-
34
-
35
-
36
-
37
-
38
-
39
-
40
-
41
-
42
-
43
-
44
-
45
-
46
-
47
-
48
-
49
-
50
-
51
-
52
-
53
-
54
-
55
-
56
-
57
-
58
-
59
-
60
-
61
-
62
-
63
-
64
 |
 |

4
CREATIVE TECHNOLOGY LTD AND ITS SUBSIDIARIES
Overview
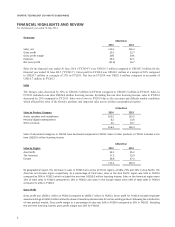
US$million
2014 2013
Sales, net 116.3 165.3
Gross prot 30.1 53.7
Gross prot margin 26% 33%
Expenses 59.6 67.1
Net (loss) prot (21.8) 16.7
Sales for the nancial year ended 30 June 2014 (“FY2014”) were US$116.3 million compared to US$165.3 million for the
nancial year ended 30 June 2013 (“FY2013”). Gross prot in FY2014 was US$30.1 million at a margin of 26% compared
to US$53.7 million at a margin of 33% in FY2013. Net loss in FY2014 was US$21.8 million compared to net prot of
US$16.7 million in FY2013.
Sales
The Group’s sales decreased by 30% to US$116.3 million in FY2014 compared to US$165.3 million in FY2013. Sales in
FY2013 included a one time US$20.0 million licensing income. Excluding this one time licensing income, sales in FY2014
decreased by 20% compared to FY2013. Sales were lower in FY2014 due to the uncertain and difcult market conditions
which affected the sales of the Group’s products and impacted sales across all three geographical regions.
US$million
Sales by Product Category 2014 2013
Audio, speakers and headphones 103.5 122.0
Personal digital entertainment 8.2 13.6
Other products 4.6 29.7
116.3 165.3
Sales of all product categories in FY2014 have decreased compared to FY2013. Sales of other products in FY2013 included a one
me US$20.0 million licensing income.
US$million
Sales by Region 2014 2013
Asia Pacic 59.3 95.2
The Americas 17.2 22.9
Europe 39.8 47.2
116.3 165.3
By geographical region, the decrease in sales in FY2014 was across all three regions at 38%, 25% and 16% in Asia Pacic, the
Americas and Europe region respecvely. As a percentage of total sales, sales in the Asia Pacic region was 51% in FY2014
compared to 58% in FY2013 which included the one me US$20.0 million licensing income. Sales in the Americas region were
15% of total sales in FY2014 compared to 14% in FY2013 and sales in the Europe region were 34% of total sales in FY2014
compared to 28% in FY2013
Gross prot was US$30.1 million in FY2014 compared to US$53.7 million in FY2013. Gross prot for FY2014 included employee
severance charge of US$0.4 million and write-down of inventory obsolescence for certain exisng products following the introducon
of new product models. Gross prot margin as a percentage of sales was 26% in FY2014 compared to 33% in FY2013. Excluding
the one me licensing income, gross prot margin was 23% for FY2013.
FINANCIAL HIGHLIGHTS AND REVIEW
For the nancial year ended 30 June 2014