Creative 2012 Annual Report Download - page 7
Download and view the complete annual report
Please find page 7 of the 2012 Creative annual report below. You can navigate through the pages in the report by either clicking on the pages listed below, or by using the keyword search tool below to find specific information within the annual report.-
 1
1 -
 2
2 -
 3
3 -
 4
4 -
 5
5 -
 6
6 -
 7
7 -
 8
8 -
 9
9 -
 10
10 -
 11
11 -
 12
12 -
 13
13 -
 14
14 -
 15
15 -
 16
16 -
 17
17 -
 18
18 -
19
-
20
-
21
-
22
-
23
-
24
-
25
-
26
-
27
-
28
-
29
-
30
-
31
-
32
-
33
-
34
-
35
-
36
-
37
-
38
-
39
-
40
-
41
-
42
-
43
-
44
-
45
-
46
-
47
-
48
-
49
-
50
-
51
-
52
-
53
-
54
-
55
-
56
-
57
-
58
-
59
-
60
-
61
-
62
-
63
-
64
-
65
-
66
-
67
-
68
 |
 |

5
CREATIVE TECHNOLOGY LTD AND ITS SUBSIDIARIES
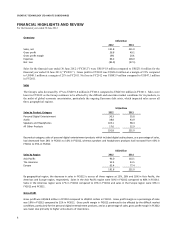
Expenses
Total expenses decreased from US$128.0 million in FY2011 to US$86.2 million in FY2012.
Selling, general and administrave expenses were US$46.5 million compared to US$61.5 million in FY2011. The decrease in
selling, general and administrave expenses was due mainly to a reducon in sales and a result of the cost cung acons taken
in FY2011.
Research and development expenses in FY2012 were US$39.6 million compared to US$66.4 million in FY2011. The decrease in
research and development expenses was mainly a result of cost cung acons taken in FY2011. Going forward, the Group will
connue to invest in product research and development in areas that are strategic to the Group, cung back spending only in
product areas that are not strategic to the Group.
Net Loss
Net loss in FY2012 was US$83.9 million compared to US$47.1 million in FY2011. Sales in FY2012 have decreased and gross prot
was lower by US$12.3 million compared to FY2011, but operang results for the Group in FY2012 have improved due to a decrease
in operang expenses by US$41.8 million compared to FY2011 as a result of the cost cung acons taken in FY2011. Despite
the improvement in operang results, the Group’s results in FY2012 were negavely impacted by other losses (net) of US$32.5
million, compared to other gains (net) of US$27.5 million in FY2011.
Other losses (net) of US$32.5 million in FY2012 comprised US$3.6 million impairment loss on unulised building facilies, US$3.3
million impairment loss on intangible assets, US$14.7 million impairment loss on property and equipment, US$6.5 million provisions
for commitments for other expenditures and obligaons by a subsidiary, QMax Communicaons Pte Ltd (“QMax”), for its wireless
broadband project in Singapore, US$8.1 million currency translaon loss, and US$3.4 million impairment loss on investments,
oset parally by US$7.1 million net gain on disposal of investments.
Impairment loss on investments was due to adverse business condions in certain investee companies. Impairment loss on unulised
building facilies of US$3.6 million was a charge taken for the commied rental and related costs of unulised space in the Group’s
headquarters building in Singapore arising from the restructuring exercise and headcount reducon in FY2011. Impairment loss
on intangible assets of US$3.3 million relates to US$2.3 million goodwill impairment charge and US$1.1 million trademark and
licenses impairment charge by QMax for its wireless broadband project. Impairment loss on property and equipment of US$14.7
million relates to US$12.2 impairment charge by QMax for its wireless broadband project and a US$2.5 million impairment charge
on a building owned by a subsidiary in Ireland to write down the book value to its esmated net realisable value. Other gains
(net) of US$27.5 million in FY2011 included a US$25.3 million currency translaon gain.
The QMax wireless broadband project has been suspended as the vendor for the equipment has failed to deliver on the key
network performance requirements set out in the relevant supply contract. The Company and QMax have given noce to the
vendor to terminate or rescind the supply contract on the grounds of material breach of the contract and/or misrepresentaons
by the vendor. The Company and QMax have also iniated legal proceedings against the vendor to recover damages and all losses
suered in relaon to the wireless broadband project. Pending the outcome of the legal proceedings, full provisions have been
made for the impairment of equipment and related intangible assets for the project, as well as provisions for commitments for
other expenditures and obligaons to third pares relang to the project.
The Group’s income tax expense was US$0.3 million in FY2012 compared to a credit of US$4.8 million in FY2011. The Group’s
income tax credit of US$4.8 million in FY2011 was due mainly to a US$3.3 million write back of deferred tax liability and a US$1.7
million write back of tax provisions. Deferred tax liability of US$3.0 million was previously provided for the tax exposure of a
subsidiary company. The amount was wrien back in FY2011 as the Group had disposed the subsidiary company in FY2011 and
is no longer liable to its tax exposure. Tax provision of US$2.0 million pertaining to open years of assessment were nalised and
wrien back by the Company in FY2011.