Creative 2012 Annual Report Download - page 6
Download and view the complete annual report
Please find page 6 of the 2012 Creative annual report below. You can navigate through the pages in the report by either clicking on the pages listed below, or by using the keyword search tool below to find specific information within the annual report.-
 1
1 -
 2
2 -
 3
3 -
 4
4 -
 5
5 -
 6
6 -
 7
7 -
 8
8 -
 9
9 -
 10
10 -
 11
11 -
 12
12 -
 13
13 -
 14
14 -
 15
15 -
 16
16 -
 17
17 -
18
-
19
-
20
-
21
-
22
-
23
-
24
-
25
-
26
-
27
-
28
-
29
-
30
-
31
-
32
-
33
-
34
-
35
-
36
-
37
-
38
-
39
-
40
-
41
-
42
-
43
-
44
-
45
-
46
-
47
-
48
-
49
-
50
-
51
-
52
-
53
-
54
-
55
-
56
-
57
-
58
-
59
-
60
-
61
-
62
-
63
-
64
-
65
-
66
-
67
-
68
 |
 |

4
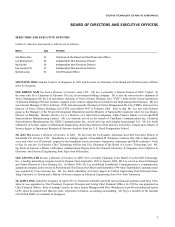
CREATIVE TECHNOLOGY LTD AND ITS SUBSIDIARIES
Overview
US$million
2012 2011
Sales, net 191.8 231.0
Gross prot 36.8 49.1
Gross prot margin 19% 21%
Expenses 86.2 128.0
Net loss (83.9) (47.1)
Sales for the nancial year ended 30 June 2012 (“FY2012”) were US$191.8 million compared to US$231.0 million for the
nancial year ended 30 June 2011 (“FY2011”). Gross prot in FY2012 was US$36.8 million at a margin of 19% compared
to US$49.1 million at a margin of 21% in FY2011. Net loss in FY2012 was US$83.9 million compared to US$47.1 million
in FY2011.
Sales
The Group’s sales decreased by 17% to US$191.8 million in FY2012 compared to US$231.0 million in FY2011. Sales were
lower in FY2012 as the Group continues to be affected by the difcult and uncertain market conditions for its products, in
the midst of global economic uncertainties, particularly the ongoing Eurozone debt crisis, which impacted sales across all
three geographical regions.
US$million
Sales by Product Category 2012 2011
Personal Digital Entertainment 30.3 55.8
Audio 38.8 43.9
Speakers and Headphones 105.1 98.4
All Other Products 17.6 32.9
191.8 231.0
By product category, sales of personal digital entertainment products which included digital audio players, as a percentage of sales,
had decreased from 24% in FY2011 to 16% in FY2012, whereas speakers and headphones products had increased from 43% in
FY2011 to 55% in FY2012.
US$million
Sales by Region 2012 2011
Asia Pacic 96.0 110.1
The Americas 32.4 43.5
Europe 63.4 77.4
191.8 231.0
By geographical region, the decrease in sales in FY2012 is across all three regions at 13%, 26% and 18% in Asia Pacic, the
Americas and Europe region, respecvely. Sales in the Asia Pacic region were 50% in FY2012 compared to 48% in FY2011.
Sales in the Americas region were 17% in FY2012 compared to 19% in FY2011 and sales in the Europe region were 33% in
FY2012 and FY2011.
Gross prot was US$36.8 million in FY2012 compared to US$49.1 million in FY2011. Gross prot margin as a percentage of sales
was 19% in FY2012 compared to 21% in FY2011. Gross prot margin in FY2012 connued to be aected by the dicult market
condions, parcularly for the personal digital entertainment products, and as a percentage of sales, gross prot margin in FY2012
was lower due primarily to higher write-downs of inventories.
FINANCIAL HIGHLIGHTS AND REVIEW
For the nancial year ended 30 June 2012