Creative 2010 Annual Report Download - page 4
Download and view the complete annual report
Please find page 4 of the 2010 Creative annual report below. You can navigate through the pages in the report by either clicking on the pages listed below, or by using the keyword search tool below to find specific information within the annual report.-
 1
1 -
 2
2 -
 3
3 -
 4
4 -
 5
5 -
 6
6 -
 7
7 -
 8
8 -
 9
9 -
 10
10 -
 11
11 -
 12
12 -
 13
13 -
 14
14 -
 15
15 -
16
-
17
-
18
-
19
-
20
-
21
-
22
-
23
-
24
-
25
-
26
-
27
-
28
-
29
-
30
-
31
-
32
-
33
-
34
-
35
-
36
-
37
-
38
-
39
-
40
-
41
-
42
-
43
-
44
-
45
-
46
-
47
-
48
-
49
-
50
-
51
-
52
-
53
-
54
-
55
-
56
-
57
-
58
-
59
-
60
-
61
-
62
-
63
-
64
 |
 |

4
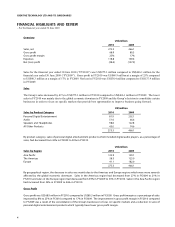
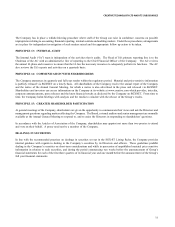
CREATIVE TECHNOLOGY LTD AND ITS SUBSIDIARIES
Overview
US$million
2010 2009
Sales, net 275.3 466.1
Gross prot 68.9 80.3
Gross prot margin 25% 17%
Expenses 118.8 169.4
Net (loss) prot (38.4) (137.9)
Sales for the nancial year ended 30 June 2010 (“FY2010”) was US$275.3 million compared to US$466.1 million for the
nancial year ended 30 June 2009 (“FY2009”). Gross prot in FY2010 was US$68.9 million at a margin of 25% compared
to US$80.3 million at a margin of 17% in FY2009. Net loss in FY2010 was US$38.4 million compared to US$137.9 million
in FY2009.
Sales
The Group’s sales decreased by 41% to US$275.3 million in FY2010 compared to US$466.1 million in FY2009. The lower
sales in FY2010 was mainly due to the global economic downturn in FY2009 and the Group’s decision to consolidate certain
businesses in order to focus on specic markets that provide best opportunities to improve business going forward.
US$million
Sales by Product Category 2010 2009
Personal Digital Entertainment 81.9 202.1
Audio 51.6 66.6
Speakers and Headphones 98.8 122.8
All Other Products 43.0 74.6
275.3 466.1
By product category, sales of personal digital entertainment products which included digital audio players, as a percentage of
sales, had decreased from 43% in FY2009 to 30% in FY2010.
US$million
Sales by Region 2010 2009
Asia Pacic 125.9 159.1
The Americas 58.3 125.0
Europe 91.1 182.0
275.3 466.1
By geographical region, the decrease in sales was mainly due to the Americas and Europe regions which were more severely
aected by the global economic downturn. Sales in the Americas region had decreased from 27% in FY2009 to 21% in
FY2010 and sales in the Europe region had decreased from 39% in FY2009 to 33% in FY2010. Sales in the Asia Pacic region
had increased from 34% in FY2009 to 46% in FY2010.
Gross Prot
Gross prot was US$68.9 million in FY2010 compared to US$80.3 million in FY2009. Gross prot margin as a percentage of sales
improved by 8% to 25% in FY2010 compared to 17% in FY2009. The improvement in gross prot margin in FY2010 compared
to FY2009 was a result of the consolidation of the Group’s businesses to focus on specic markets and a reduction in sales of
personal digital entertainment products which typically have lower gross prot margin.
fInAncIAl HIGHlIGHts And RevIew
– For the nancial year ended 30 June 2010