Creative 2004 Annual Report Download - page 16
Download and view the complete annual report
Please find page 16 of the 2004 Creative annual report below. You can navigate through the pages in the report by either clicking on the pages listed below, or by using the keyword search tool below to find specific information within the annual report.-
 1
1 -
2
-
3
-
4
-
5
-
 6
6 -
 7
7 -
 8
8 -
 9
9 -
 10
10 -
 11
11 -
 12
12 -
 13
13 -
 14
14 -
 15
15 -
 16
16 -
 17
17 -
 18
18 -
 19
19 -
 20
20 -
 21
21 -
 22
22 -
 23
23 -
 24
24 -
 25
25 -
 26
26 -
27
-
28
-
29
-
30
-
31
-
32
-
33
-
34
-
35
-
36
-
37
-
38
-
39
-
40
-
41
-
42
-
43
-
44
-
45
-
46
 |
 |

14
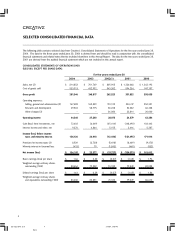
LIQUIDITY AND CAPITAL RESOURCES
Cash and cash equivalents at June 30, 2004 were $211.1 million, a decrease of $20.9 million compared to the balance of
$232.0 million at June 30, 2003.
Operating Activities
Net cash used in operating activities during fiscal 2004 was $20.7 million compared with net cash generated of $99.7 million
in fiscal 2003. The cash used in operating activities of $20.7 million relates mainly to adjustments for non-cash items of $41.5
million, a $103.5 million net increase in inventory, and a $42.2 million increase in accounts receivable and other assets and
prepaid. These were offset in part by contributions from a net increase of $41.7 million in accounts payable and accrued and
other liabilities. The $41.5 million in adjustments to non-cash items include depreciation and amortization of $25.9 million,
a $52.9 million gain from the disposal of investments and interests in an associated company, and a non-cash gain of $23.1
million arising from the deemed disposal of interests in an associated company, (see Note 15 of “Notes to Consolidated
Financial Statements”). The operating cash outflow was primarily due to the $103.5 million increase in inventory. The
increase was in response to the anticipated strong year over year growth in demand, especially for PDE products, and to
support the launch of new products for the upcoming holiday season.
Net cash generated from operating activities during fiscal 2003 was $99.7 million compared with $89.4 million in fiscal 2002.
The cash generated during fiscal 2003 primarily resulted from net adjustments of $37.6 million for non-cash items, a net
decrease in accounts receivable and other assets and prepaid of $30.5 million, a net decrease in inventory of $28.2 million,
which is in line with lower sales and management’s decision to maintain a lower inventory level, and a decrease in marketable
Unaudited data for quarters ended (as a percentage of sales)
Jun 30 Mar 31 Dec 31 Sep 30 Jun 30 Mar 31 Dec 31 Sep 30
2004 2004 2003 2003 2003 2003 2002 2002
Sales, net 100 % 100 % 100 % 100 % 100 % 100 % 100 % 100 %
Cost of goods sold 67 66 64 65 65 65 65 64
Gross profit 33 34 36 35 35 35 35 36
Operating Expenses:
Selling, general and
administrative 20 21 19 23 23 23 21 26
Research and development 10 9 7 9 10 9 6 10
Operating income 3 4 10 3 2 3 8 –
Net gain (loss) from investments – 24 1 15 – – – (4)
Interest income and other, net – 1 2 1 1 1 1 1
Income (loss) before income
taxes and minority interest 3 29 13 19 3 4 9 (3)
Provision for income taxes – (1) 4 (1) – (1) (1) –
Minority interest in (income) loss – – – – – – – –
Net income (loss) 3 % 28 % 17 % 18 % 3 % 3 % 8 % (3) %
MANAGEMENT’S DISCUSSION AND ANALYSIS OF
FINANCIAL CONDITION AND RESULTS OF OPERATIONS
US report 04-6 22-9 27/9/04, 3:40 PM14
Black