Creative 2004 Annual Report Download - page 12
Download and view the complete annual report
Please find page 12 of the 2004 Creative annual report below. You can navigate through the pages in the report by either clicking on the pages listed below, or by using the keyword search tool below to find specific information within the annual report.-
 1
1 -
 2
2 -
 3
3 -
 4
4 -
 5
5 -
 6
6 -
 7
7 -
 8
8 -
 9
9 -
 10
10 -
 11
11 -
 12
12 -
 13
13 -
 14
14 -
 15
15 -
 16
16 -
 17
17 -
 18
18 -
 19
19 -
 20
20 -
 21
21 -
 22
22 -
23
-
24
-
25
-
26
-
27
-
28
-
29
-
30
-
31
-
32
-
33
-
34
-
35
-
36
-
37
-
38
-
39
-
40
-
41
-
42
-
43
-
44
-
45
-
46
 |
 |

10
MANAGEMENT’S DISCUSSION AND ANALYSIS OF
FINANCIAL CONDITION AND RESULTS OF OPERATIONS
YEAR ENDED JUNE 30, 2004 COMPARED TO YEAR ENDED JUNE 30, 2003
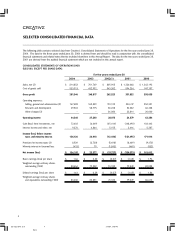
Net sales
Net sales for the year ended June 30, 2004 increased by 16% compared to the year ended June 30, 2003. The revenue
increase was mainly attributable to Creative’s strategy of focusing on audio products, speakers and personal digital entertainment
(“PDE”) products outside the personal computer (“PC”) box. Audio product sales (Sound Blaster audio cards and chipsets)
declined by 14% compared to fiscal year 2003, and as a percentage of sales, represented 25% of sales in fiscal 2004
compared to 33% in fiscal 2003. Sales for high-end retail audio products such as the Audigy line of products were higher
in fiscal 2004 compared to fiscal 2003. Overall audio sales in fiscal 2004 were lower compared to fiscal 2003 primarily due
to a drop in sales through original equipment manufacturers (“OEM”), particularly sales of low-end audio products. Sales
of speakers increased by 16% in fiscal 2004 compared to fiscal 2003 mainly due to strong demand for new models of high-
end GigaWorks speakers, I-Trigue speakers and portable TravelSound speakers. As a percentage of sales, speakers remained
at 23% of sales in fiscal 2004 compared to fiscal 2003. Sales of PDE products, which include digital audio players and digital
cameras, increased by 115% compared to fiscal 2003 and comprised 33% of sales compared to 18% in fiscal 2003. In fiscal
2004, Creative launched a number of new digital audio players and expanded its existing MuVo family of flash players and
Zen family of hard drive players which helped the company to strengthen its market share in digital audio players. The
significant increase in PDE sales in fiscal 2004 was driven by strong demand for MuVo flash players, MuVo2 hard drive players
and the Jukebox Zen. Sales of graphics products in fiscal 2004 decreased by 21% compared to fiscal 2003, and as a
percentage of sales, decreased from 12% in fiscal 2003 to 8% in fiscal 2004. Sales of communication products decreased
by 32% in fiscal 2004 compared to fiscal 2003, and as a percentage of sales, decreased from 6% in fiscal 2003 to 4% in
fiscal 2004. Sales of communication products were higher in fiscal 2003 due to a major deal to supply broadband modems
to a customer between March 2002 and September 2002. Sales of other products, which include mouse and keyboard
products, music products, accessories and other miscellaneous items, increased by 17% in fiscal 2004 compared to fiscal
2003 but, as a percentage of sales decreased from 8% in fiscal 2003 to 7% in fiscal 2004.
Gross profit
Gross profit in fiscal 2004 was 34.5% of sales compared to 35.5% in fiscal 2003. The decrease in gross profit was primarily
attributable to the mix of products sold in fiscal 2004 with a higher percentage of sales coming from PDE products and a
lower percentage of sales coming from audio products. However, Creative was able to maintain a relatively high level of gross
margin primarily due to its focus on products outside the PC box.
Operating expenses
Selling, general and administrative (“SG&A”) expenses in fiscal 2004 increased marginally by 3% compared to fiscal 2003.
The increase in SG&A expenses was mainly attributable to an increase in sales and marketing expenses which were in line
with the increase in net sales, and an increase in expenses related to the company’s European operations due to the
strengthening of the Euro compared to the U.S. dollar during fiscal 2004. As a percentage of sales, SG&A expenses were
21% of sales compared to 23% of sales in fiscal 2003. Research and development (“R&D”) expenses increased by 18%
primarily due to an increase in resources to develop new products. As a percentage of sales, R&D expenses remained at
8% of sales in fiscal 2004 compared to fiscal 2003.
Net investment gain (loss)
Net investment gain of $72.6 million in fiscal 2004 comprised a $52.9 million gain from sales of investments and a $23.1
million non-cash gain on a “deemed disposal” of interests in an associated company, SigmaTel, Inc (“SigmaTel”), offset by
$3.4 million in permanent write-downs of unquoted investments. The “deemed disposal” of interests in SigmaTel resulted
from SigmaTel’s initial public offering common stock in the United States. As a result of SigmaTel’s initial public offering,
Creative’s ownership percentage in the company was reduced even though Creative did not dispose any of its shareholdings
US report 04-6 22-9 27/9/04, 3:40 PM10
Black