Creative 2000 Annual Report Download - page 6
Download and view the complete annual report
Please find page 6 of the 2000 Creative annual report below. You can navigate through the pages in the report by either clicking on the pages listed below, or by using the keyword search tool below to find specific information within the annual report.-
 1
1 -
 2
2 -
 3
3 -
 4
4 -
 5
5 -
 6
6 -
 7
7 -
 8
8 -
 9
9 -
 10
10 -
 11
11 -
 12
12 -
 13
13 -
 14
14 -
 15
15 -
 16
16 -
 17
17 -
18
-
19
-
20
-
21
-
22
-
23
-
24
-
25
-
26
-
27
-
28
-
29
-
30
-
31
-
32
-
33
-
34
-
35
-
36
-
37
-
38
-
39
-
40
-
41
-
42
-
43
-
44
 |
 |

6
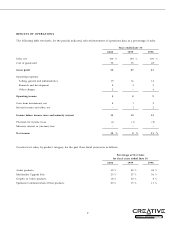
The following table sets out selected data from Creative’s Consolidated Statements of Operations for the five years ended
June 30, 2000. The data for the three years ended June 30, 2000 is qualified by reference to, and should be read in
conjunction with, the consolidated financial statements and related notes thereto included elsewhere in this Annual Report.
CONSOLIDATED STATEMENTS OF OPERATIONS DATA
(US$’000, EXCEPT PER SHARE DATA):
For the years ended June 30
2000 1999 1998(1) 1997 1996
Sales, net $ 1,343,604 $ 1,296,537 $ 1,234,208 $ 1,232,957 $ 1,308,061
Cost of goods sold 947,157 944,499 848,305 893,432 1,120,977
Gross profit 396,447 352,038 385,903 339,525 187,084
Operating expenses:
Selling, general and administrative 253,733 209,668 162,464 135,644 148,351
Research and development 60,428 46,725 41,723 35,164 34,756
Other charges (2) 20,000 – 68,568 – 18,780
Operating income (loss) 62,286 95,645 113,148 168,717 (14,803)
Gain from investments, net 103,443 15,048 18,469 6,803 —
Interest income (expense)
and other, net 5,287 14,621 21,183 11,579 (14,793)
Income (loss) before income
taxes and minority interest 171,016 125,314 152,800 187,099 (29,596)
Provision for income taxes (3) (9,472) (9,920) (19,805) (20,073) (8,767)
Minority interest in (income) loss (532) (312) 1,779 20 719
Net income (loss) $ 161,012 $ 115,082 $ 134,774 $ 167,046 $ (37,644)
Basic earnings (loss) per share $ 1.96 $ 1.28 $ 1.49 $ 1.89 $ (0.43)
Average ordinary shares
outstanding (’000) 82,028 89,818 90,654 88,422 87,984
Diluted earnings (loss) per share $ 1.86 $ 1.25 $ 1.42 $ 1.84 $ (0.43)
Average ordinary shares and
equivalents outstanding (’000) 86,612 92,241 94,964 90,763 87,984
SELECTED CONSOLIDATED FINANCIAL DATA