Creative 2000 Annual Report Download - page 12
Download and view the complete annual report
Please find page 12 of the 2000 Creative annual report below. You can navigate through the pages in the report by either clicking on the pages listed below, or by using the keyword search tool below to find specific information within the annual report.-
 1
1 -
 2
2 -
 3
3 -
 4
4 -
 5
5 -
 6
6 -
 7
7 -
 8
8 -
 9
9 -
 10
10 -
 11
11 -
 12
12 -
 13
13 -
 14
14 -
 15
15 -
 16
16 -
 17
17 -
 18
18 -
 19
19 -
 20
20 -
 21
21 -
 22
22 -
23
-
24
-
25
-
26
-
27
-
28
-
29
-
30
-
31
-
32
-
33
-
34
-
35
-
36
-
37
-
38
-
39
-
40
-
41
-
42
-
43
-
44
 |
 |

12
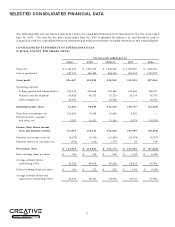
QUARTERLY RESULTS
The following is a summary of Creative’s unaudited quarterly results for the eight quarters ended June 30, 2000, together with
the percentage of sales represented by such results. Consistent with the PC peripheral market, due to consumer buying
patterns, demand for Creative’s products is generally stronger in the quarter ended December 31, compared to any other
quarter of the fiscal year. In management’s opinion, the results detailed below have been prepared on a basis consistent with
the audited financial statements and include all adjustments, consisting only of normal recurring adjustments, necessary for
a fair presentation of the information for the periods presented when read in conjunction with the financial statements and
notes thereto contained elsewhere herein. Creative’s business is seasonal in nature and the quarterly results are not necessarily
indicative of the results to be achieved for the complete year.
Unaudited data for quarters ended (in US$’000 except per share data)
Jun 30 Mar 31 Dec 31 Sep 30 Jun 30 Mar 31 Dec 31 Sep 30
2000 2000 1999 1999 1999 1999 1998 1998
Sales, net $ 307,715 $ 330,022 $ 436,789 $ 269,078 $ 275,134 $ 313,715 $ 428,699 $ 278,989
Cost of goods sold 212,739 228,444 306,912 199,062 213,071 232,964 299,308 199,156
Gross profit 94,976 101,578 129,877 70,016 62,063 80,751 129,391 79,833
Operating expenses:
Selling, general and
administrative 59,724 64,167 76,340 53,502 47,966 51,534 58,445 51,723
Research and development 16,460 16,538 14,717 12,713 12,873 11,825 11,681 10,346
Other charges (1) 20,000 –––––––
Operating (loss) income (1,208) 20,873 38,820 3,801 1,224 17,392 59,265 17,764
Net gain from investments 19,211 70,632 9,235 4,365 12,562 239 2,247 –
Interest income (expense)
and other, net 1,055 (542) 918 3,856 2,488 2,669 3,847 5,617
Income before income
taxes and minority interest 19,058 90,963 48,973 12,022 16,274 20,300 65,359 23,381
Provision for income taxes (2,004) (2,327) (3,939) (1,202) (1,303) (1,624) (4,889) (2,104)
Minority interest in
(income) loss 349 (317) (554) (10) (235) (425) 112 236
Net income $ 17,403 $ 88,319 $ 44,480 $ 10,810 $ 14,736 $ 18,251 $ 60,582 $ 21,513
Basic earnings per share $ 0.21 $ 1.09 $ 0.54 $ 0.13 $ 0.17 $ 0.21 $ 0.66 $ 0.23
Average ordinary shares
outstanding (’000) 81,367 81,339 81,999 83,410 85,457 88,398 92,428 92,989
Diluted earnings per share $ 0.20 $ 1.01 $ 0.52 $ 0.13 $ 0.17 $ 0.20 $ 0.64 $ 0.23
Average ordinary shares and
equivalents outstanding (’000) 87,605 87,697 86,291 84,855 88,026 90,835 95,137 94,968
MANAGEMENT’S DISCUSSION AND ANALYSIS OF
FINANCIAL CONDITION AND RESULTS OF OPERATIONS