Cracker Barrel 2011 Annual Report Download - page 4
Download and view the complete annual report
Please find page 4 of the 2011 Cracker Barrel annual report below. You can navigate through the pages in the report by either clicking on the pages listed below, or by using the keyword search tool below to find specific information within the annual report.-
 1
1 -
 2
2 -
 3
3 -
 4
4 -
 5
5 -
 6
6 -
 7
7 -
 8
8 -
 9
9 -
 10
10 -
 11
11 -
 12
12 -
 13
13 -
 14
14 -
 15
15 -
16
-
17
-
18
-
19
-
20
-
21
-
22
-
23
-
24
-
25
-
26
-
27
-
28
-
29
-
30
-
31
-
32
-
33
-
34
-
35
-
36
-
37
-
38
-
39
-
40
-
41
-
42
-
43
-
44
-
45
-
46
-
47
-
48
-
49
-
50
-
51
-
52
-
53
-
54
-
55
-
56
 |
 |

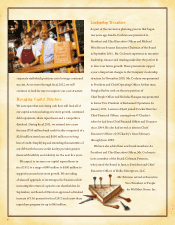
Q1%( %*# +* +1. ,.+ 10 *
,.+)+0%+*(/0.0!#5
B1DUUDWLYHLQGG $0
For the 2011 fiscal year, we reported earnings per
diluted share of $3.61 compared with $3.62 in fiscal
2010. Fiscal 2011 earnings included charges related to a
headcount reduction at the home office in July and
expenses associated with the new bank facility, which
together reduced earnings per diluted share by $0.25.
Several factors affected our performance. Like the rest of
the industry, we faced food commodity costs which were
higher than anticipated. Moreover, increased fuel, food
and other everyday living costs have put pressure on our
guests and have affected both the frequency of their
dining out and the amount they spend in our stores. Our
market research shows that we have more parties with
chains. ese families, as well as our older guests, tend
to have fewer discretionary dollars for dining out. e
headwinds generated by these factors appeared to have
heightened during the summer travel season, which
coincides with our fourth fiscal quarter.
We were pleased with the job our operating teams did
managing our costs effectively to help offset the impact
from these pressures.
One of the areas where we made progress but need
continued focus is improving the guest experience.
We completed the roll-out of the Seat to Eat operating
platform in fiscal 2011. While we anticipated a certain
level of disruption to the guest experience
during the roll-out, implementing
Seat to Eat created greater
operational challenges
than we expected. We
achieved our primary
goal as our guest satisfaction scores for speed of
service are significantly higher than before the program
was initiated. However, guest satisfaction rankings
on other aributes, such as accuracy of order and friend-
liness of server, declined somewhat. e Seat to Eat
operating platform changed a number of processes in
each restaurant including order taking, food preparation
and how the food is served; it also introduced continuous
monitoring of the time it takes to prepare orders for
delivery to the table. In short, it required large-scale
changes to the way every one of our restaurants operates
every day. We remain confident that the operating
platform is sound, but making refinements is a priority
for us. We are addressing the areas where guest satisfac-
tion rankings declined, and we have identified
adjustments that are needed, especially in the critical
area of guest-server interaction, to make sure we continue
to provide the dining experience our guests expect.
In addition to strengthening our operating platform, we
are enhancing our product and promotional strategies to
2
children under the age of eleven than most casual dining