Cogeco 2014 Annual Report Download - page 5
Download and view the complete annual report
Please find page 5 of the 2014 Cogeco annual report below. You can navigate through the pages in the report by either clicking on the pages listed below, or by using the keyword search tool below to find specific information within the annual report.-
 1
1 -
 2
2 -
 3
3 -
 4
4 -
 5
5 -
 6
6 -
 7
7 -
 8
8 -
 9
9 -
 10
10 -
 11
11 -
 12
12 -
 13
13 -
 14
14 -
 15
15 -
 16
16 -
17
-
18
-
19
-
20
-
21
-
22
-
23
-
24
-
25
-
26
-
27
-
28
-
29
-
30
-
31
-
32
-
33
-
34
-
35
-
36
-
37
-
38
-
39
-
40
-
41
-
42
-
43
-
44
-
45
-
46
-
47
-
48
-
49
-
50
-
51
-
52
-
53
-
54
-
55
-
56
-
57
-
58
-
59
-
60
-
61
-
62
-
63
-
64
-
65
-
66
-
67
-
68
-
69
-
70
-
71
-
72
-
73
-
74
-
75
-
76
-
77
-
78
-
79
-
80
-
81
-
82
-
83
-
84
-
85
-
86
-
87
-
88
-
89
-
90
-
91
-
92
-
93
-
94
-
95
-
96
-
97
-
98
-
99
-
100
-
101
-
102
-
103
-
104
-
105
 |
 |

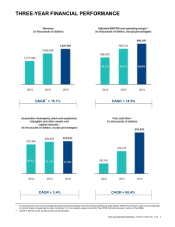
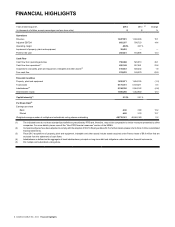
4 COGECO CABLE INC. 2014 Financial highlights
FINANCIAL HIGHLIGHTS
Years ended August 31, 2014 2013 (2) Change
(in thousands of dollars, except percentages and per share data) $$ %
Operations
Revenue 1,947,591 1,692,466 15.1
Adjusted EBITDA 893,357 780,723 14.4
Operating margin 45.9% 46.1%
Impairment of property, plant and equipment 35,493 — —
Profit for the year 209,441 184,895 13.3
Cash Flow
Cash flow from operating activities 758,368 545,010 39.1
Cash flow from operations(1) 690,148 557,581 23.8
Acquisitions of property, plant and equipment, intangible and other assets(3) 415,472 408,202 1.8
Free cash flow 274,676 149,379 83.9
Financial Condition
Property, plant and equipment 1,830,971 1,854,155 (1.3)
Total assets 5,173,741 5,149,211 0.5
Indebtedness(4) 2,744,746 2,944,182 (6.8)
Shareholders' equity 1,508,256 1,342,940 12.3
Capital intensity(1) 21.3% 24.1%
Per Share Data(5)
Earnings per share
Basic 4.30 3.80 13.2
Diluted 4.26 3.78 12.7
Weighted average number of multiple and subordinate voting shares outstanding 48,735,341 48,646,340 0.2
(1) The indicated terms do not have standardized definitions prescribed by IFRS and, therefore, may not be comparable to similar measures presented by other
companies. For more details, please consult the “Non-IFRS financial measures” section of the MD&A.
(2) Comparative figures have been adjusted to comply with the adoption of IAS 19 Employee Benefits. For further details, please refer to Note 3 of the consolidated
financial statements.
(3) Fiscal 2013 acquisitions of property, plant and equipment, intangible and other assets include assets acquired under finance lease of $0.9 million that are
excluded from the statements of cash flows.
(4) Indebtedness is defined as the aggregate of bank indebtedness, principal on long-term debt and obligations under derivative financial instruments.
(5) Per multiple and subordinate voting share.