Cogeco 2010 Annual Report Download - page 5
Download and view the complete annual report
Please find page 5 of the 2010 Cogeco annual report below. You can navigate through the pages in the report by either clicking on the pages listed below, or by using the keyword search tool below to find specific information within the annual report.-
 1
1 -
 2
2 -
 3
3 -
 4
4 -
 5
5 -
 6
6 -
 7
7 -
 8
8 -
 9
9 -
 10
10 -
 11
11 -
 12
12 -
 13
13 -
 14
14 -
 15
15 -
 16
16 -
17
-
18
-
19
-
20
-
21
-
22
-
23
-
24
-
25
-
26
-
27
-
28
-
29
-
30
-
31
-
32
-
33
-
34
-
35
-
36
-
37
-
38
-
39
-
40
-
41
-
42
-
43
-
44
-
45
-
46
-
47
-
48
-
49
-
50
-
51
-
52
-
53
-
54
-
55
-
56
-
57
-
58
-
59
-
60
-
61
-
62
-
63
-
64
-
65
-
66
-
67
-
68
-
69
-
70
-
71
-
72
-
73
-
74
-
75
-
76
-
77
-
78
-
79
-
80
-
81
-
82
-
83
-
84
 |
 |

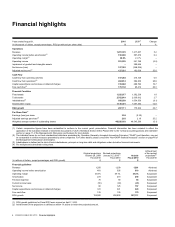
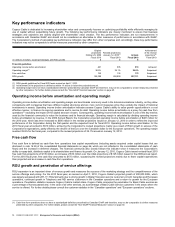
4 COGECO CABLE INC. 2010 Financial highlights
Financial highlights
Years ended August 31, 2010 2009
(1)
Change
(in thousands of dollars, except percentages, RGU growth and per share data) $$%
Operations
Revenue 1,281,376 1,217,837 5.2
Operating income before amortization(2) 510,096 507,876 0.4
Operating margin(2) 39.8% 41.7% –
Operating income 251,225 251,799 (0.2)
Impairment of goodwill and intangible assets – 399,648 –
Net income (loss) 157,303 (258,228) –
A
djusted net income(2) 127,521 102,039 25.0
Cash Flow
Cash flow from operating activities 417,284 415,169 0.5
Cash flow from operations(2) 494,814 384,206 28.8
Capital expenditures and increase in deferred charges 319,682 288,794 10.7
Free cash flow(2) 175,132 95,412 83.6
Financial Condition
Fixed assets 1,325,077 1,302,238 1.8
Total assets 2,702,819 2,630,912 2.7
Indebtedness(3) 958,939 1,054,506 (9.1)
Shareholders’ equity 1,136,301 1,007,384 12.8
RGU growth 287,111 175,364 63.7
Per Share Data(4)
Earnings (loss) per share 3.24 (5.32) –
A
djusted earnings per share(2) 2.63 2.10 25.2
Weighted average number of outstanding shares 48,520,183 48,545,296 (0.1)
(1) Certain comparative figures have been reclassified to conform to the current year’s presentation. Financial information has been restated to reflect the
application of the Canadian Institute of Chartered Accountants (“CICA”) Handbook Section 3064. Please refer to the “Critical accounting policies and estimates”
section on page 11 of the Management’s Discussion and Analysis for more details.
(2) The indicated terms do not have standardized definitions prescribed by Canadian Generally Accepted Accounting Principles (“GAAP”) and therefore, may not
be comparable to similar measures presented by other companies. For further details, please consult the “Non-GAAP financial measures” section on page 40 o
f
the Management’s Discussion and Analysis.
(3) Indebtedness is defined as the total of bank indebtedness, principal on long-term debt and obligations under derivative financial instruments.
(4) Per multiple and subordinate voting share.
Original projections
October 29, 2009
Fiscal 2010
Revised projections
January 12, 2010(1)
Fiscal 2010
Actuals
Fiscal 2010
Achievement
of the revised
projections(2)
Fiscal 2010
(in millions of dollars, except percentages and RGU growth) $$$
Financial guidelines
Revenue 1,250 1,290 1,281 Achieved
Operating income before amortization 481 505 510 Achieved
Operating margin 38.5% 39.1% 39.8% Surpassed
A
mortization 273 273 259 Surpassed
Financial expense 70 69 65 Surpassed
Current income taxes (55) (40) (41 ) Surpassed
Net income 80 125 157 Surpassed
Capital expenditures and increase in deferred charges 341 341 320 Surpassed
Free cash flow 125 135 175 Surpassed
RGU growth 125,000 200,000 287,111 Surpassed
(1) RGU growth guidelines for Fiscal 2010 were revised on April 7, 2010.
(2) Achievement of the projections is defined as within 1% above or below the projected amount.