Cogeco 2010 Annual Report Download - page 11
Download and view the complete annual report
Please find page 11 of the 2010 Cogeco annual report below. You can navigate through the pages in the report by either clicking on the pages listed below, or by using the keyword search tool below to find specific information within the annual report.-
 1
1 -
 2
2 -
 3
3 -
 4
4 -
 5
5 -
 6
6 -
 7
7 -
 8
8 -
 9
9 -
 10
10 -
 11
11 -
 12
12 -
 13
13 -
 14
14 -
 15
15 -
 16
16 -
 17
17 -
 18
18 -
 19
19 -
 20
20 -
 21
21 -
 22
22 -
23
-
24
-
25
-
26
-
27
-
28
-
29
-
30
-
31
-
32
-
33
-
34
-
35
-
36
-
37
-
38
-
39
-
40
-
41
-
42
-
43
-
44
-
45
-
46
-
47
-
48
-
49
-
50
-
51
-
52
-
53
-
54
-
55
-
56
-
57
-
58
-
59
-
60
-
61
-
62
-
63
-
64
-
65
-
66
-
67
-
68
-
69
-
70
-
71
-
72
-
73
-
74
-
75
-
76
-
77
-
78
-
79
-
80
-
81
-
82
-
83
-
84
 |
 |

10 COGECO CABLE INC. 2010 Management’s Discussion and Analysis (MD&A)
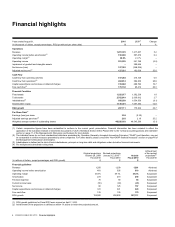
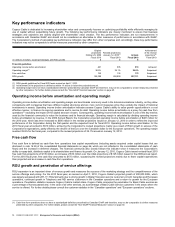
Key performance indicators
Cogeco Cable is dedicated to increasing shareholder value and consequently focuses on optimizing profitability while efficiently managing its
use of capital without jeopardizing future growth. The following key performance indicators are closely monitored to ensure that business
strategies and objectives are closely aligned with shareholder value creation. The key performance indicators are not measurements in
accordance with Canadian GAAP and should not be considered an alternative to other measures of performance in accordance with GAAP.
The Corporation’s method of calculating key performance indicators may differ from other companies and, accordingly, these key performance
indicators may not be comparable to similar measures presented by other companies.
Original
projections
October 29, 2009
Fiscal 2010
Revised projections
January 12, 2010(1)
Fiscal 2010
Actuals
Fiscal 2010
Achievemen
t
of the revised
projections(2)
Fiscal 2010
(in millions of dollars, except percentages and RGU growth) $$$
Financial guidelines
Operating income before amortization 481 505 510 Achieved
Operating margin(3) 38.5% 39.1% 39.8% Surpassed
Free cash flow 125 135 175 Surpassed
RGU growth 125,000 200,000 287,111 Surpassed
(1) RGU growth guidelines for Fiscal 2010 were revised on April 7, 2010.
(2) Achievement of the projections is defined as within 1% above or below the projected amount.
(3) Operating margin does not have a standardized definition prescribed by Canadian GAAP and therefore, may not be comparable to similar measures presented
by other companies. For further details, please consult the “Non-GAAP financial measures” section on page 40.
Operating income before amortization and operating margin
Operating income before amortization and operating margin are benchmarks commonly used in the telecommunications industry, as they allow
comparisons with companies that have different capital structures and are more current measures since they exclude the impact of historical
investments in assets. Operating income before amortization indicators assess Cogeco Cable’s ability to seize growth opportunities in a cost
effective manner, to finance its ongoing operations and to service its debt. Operating income before amortization is a proxy for cash flow from
operations(1) excluding the impact of the capital structure chosen. Consequently, operating income before amortization is one of the key metrics
used by the financial community to value the business and its financial strength. Operating margin is calculated by dividing operating income
before amortization by revenue. In the 2009 Annual Report, the Corporation projected operating income before amortization of $481 million for
the 2010 year, which was then increased to $505 million in the revised projections issued on January 12, 2010 in order to reflect the improved
performance of the Corporation during the first quarter and the expected trend for fiscal 2010. Operating income before amortization for the
2010 fiscal year amounted to $510 million, achieving the Corporation’s revised projections mainly as a result of RGU growth in excess of the
Corporation’s expectations, partly offset by the decline of the Euro over the Canadian dollar for the European operations. The operating margin
reached 39.8% for the fiscal year, compared to the revised projections of 39.1% issued on January 12, 2010.
Free cash flow
Free cash flow is defined as cash flow from operations less capital expenditures (including assets acquired under capital leases that are
disclosed in note 16 B) of the consolidated financial statements on page 66, which are not reflected in the consolidated statements of cash
flows) and the increase in deferred charges. The financial community also closely follows this indicator since it measures the Corporation’s
ability to repay debt, distribute capital to its shareholders and finance its growth. On January 12, 2010, Cogeco Cable issued revised fiscal 2010
free cash flow projections of $135 million, an increase of $10 million over the initial projections of $125 million issued in the 2009 annual report.
For the 2010 fiscal year, free cash flow amounted to $175 million, surpassing the revised projections mainly due to fewer capital expenditures
than projected and an increase in cash flow from operations.
RGU growth and penetration of service offerings
RGU expansion is an important driver of revenue growth and measures the success of the marketing strategy and the competitiveness of the
service offerings and pricing. For the 2010 fiscal year, as revised on April 7, 2010, Cogeco Cable’s projected growth of 200,000 RGU, which
was largely surpassed with 287,111 RGU primarily due to strong growth in Digital Television service customers in both Canadian and European
operations, continued growth in Telephony and HSI service customers in the Canadian operations and a return to growth for the European
operations. Penetration statistics measure Cogeco Cable’s market share. Cogeco Cable computes the penetration for Basic Cable services as
a percentage of homes passed and, in the case of all other services, as a percentage of Basic Cable Service customers in the areas where the
service is offered. For further details please consult the customer statistics in the “Canadian operations” and “European operations” sections.
(1) Cash flow from operations does not have a standardized definition prescribed by Canadian GAAP and therefore, may not be comparable to similar measures
presented by other companies. For further details, please consult the “Non-GAAP Financial Measures” section on page 40.