Coach 2008 Annual Report Download - page 18
Download and view the complete annual report
Please find page 18 of the 2008 Coach annual report below. You can navigate through the pages in the report by either clicking on the pages listed below, or by using the keyword search tool below to find specific information within the annual report.-
 1
1 -
2
-
3
-
4
-
5
-
6
-
7
-
 8
8 -
 9
9 -
 10
10 -
 11
11 -
 12
12 -
 13
13 -
 14
14 -
 15
15 -
 16
16 -
 17
17 -
 18
18 -
 19
19 -
 20
20 -
 21
21 -
 22
22 -
 23
23 -
 24
24 -
 25
25 -
 26
26 -
 27
27 -
 28
28 -
29
-
30
-
31
-
32
-
33
-
34
-
35
-
36
-
37
-
38
-
39
-
40
-
41
-
42
-
43
-
44
-
45
-
46
-
47
-
48
-
49
-
50
-
51
-
52
-
53
-
54
-
55
-
56
-
57
-
58
-
59
-
60
-
61
-
62
-
63
-
64
-
65
-
66
-
67
-
68
-
69
-
70
-
71
-
72
-
73
-
74
-
75
-
76
-
77
-
78
-
79
-
80
-
81
-
82
-
83
 |
 |

TABLE OF CONTENTS
PART II
Item 5. Market for Registrant’s Common Equity, Related Stockholder Matters and Issuer Purchases of Equity Securities
Refer to the information regarding the market for Coach’s common stock, the quarterly market price information and the number of
common shareholders of record appearing under the caption “Market and Dividend Information” included herein.
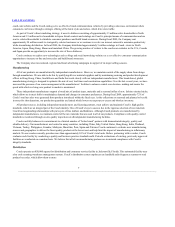
Performance Graph
The following graph compares the cumulative total stockholder return (assuming investment of dividends) of Coach’s common stock
with the cumulative total return of the S&P 500 Stock Index and the “peer group” companies listed below over the five-fiscal-year period
from July 2, 2004 through June 26, 2009, the last trading day of Coach’s most recent fiscal year. Coach’s “peer group,” as determined by
management, consists of:
•Ann Taylor Stores Corporation,
•Kenneth Cole Productions, Inc.,
•Polo Ralph Lauren Corporation,
•Tiffany & Co.,
•Talbots, Inc., and
•Williams-Sonoma, Inc.
Jul-04 Jul-05 Jul-06 Jun-07 Jun-08 Jun-09
Coach, Inc. 100.00 145.67 129.75 205.64 125.32 117.18
Peer Composite 100.00 100.96 105.59 135.74 88.06 57.70
S&P 500 100.00 107.77 117.07 141.18 122.65 90.45
The graph assumes that $100 was invested on July 2, 2004 at the per share closing price in each of Coach’s common stock, the S&P
500 Stock Index and a “Peer Composite” index compiled by us tracking the peer group companies listed above, and that all dividends were
reinvested. The stock performance shown in the graph is included in response to the SEC’s requirements and is not intended to forecast or
be indicative of future performance.
14