Cisco 2012 Annual Report Download - page 63
Download and view the complete annual report
Please find page 63 of the 2012 Cisco annual report below. You can navigate through the pages in the report by either clicking on the pages listed below, or by using the keyword search tool below to find specific information within the annual report.-
 1
1 -
2
-
3
-
4
-
5
-
6
-
7
-
8
-
9
-
10
-
11
-
12
-
13
-
14
-
15
-
16
-
17
-
18
-
19
-
20
-
21
-
22
-
23
-
24
-
25
-
26
-
27
-
28
-
29
-
30
-
31
-
32
-
33
-
34
-
35
-
36
-
37
-
38
-
39
-
40
-
41
-
42
-
43
-
44
-
45
-
46
-
47
-
48
-
49
-
50
-
51
-
52
-
 53
53 -
 54
54 -
 55
55 -
 56
56 -
 57
57 -
 58
58 -
 59
59 -
 60
60 -
 61
61 -
 62
62 -
 63
63 -
 64
64 -
 65
65 -
 66
66 -
 67
67 -
 68
68 -
 69
69 -
 70
70 -
 71
71 -
 72
72 -
 73
73 -
74
-
75
-
76
-
77
-
78
-
79
-
80
-
81
-
82
-
83
-
84
-
85
-
86
-
87
-
88
-
89
-
90
-
91
-
92
-
93
-
94
-
95
-
96
-
97
-
98
-
99
-
100
-
101
-
102
-
103
-
104
-
105
-
106
-
107
-
108
-
109
-
110
-
111
-
112
-
113
-
114
-
115
-
116
-
117
-
118
-
119
-
120
-
121
-
122
-
123
-
124
-
125
-
126
-
127
-
128
-
129
-
130
-
131
-
132
-
133
-
134
-
135
-
136
-
137
-
138
-
139
-
140
-
141
-
142
-
143
-
144
-
145
-
146
-
147
-
148
-
149
-
150
-
151
-
152
 |
 |

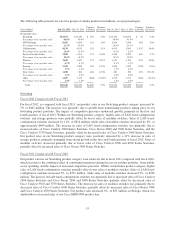
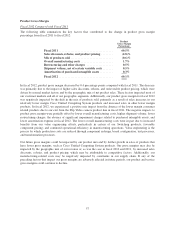
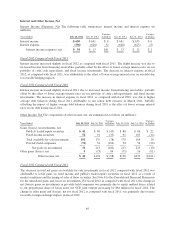
Fiscal 2011 Compared with Fiscal 2010
Sales of Service Provider Video products increased by 6%, or $189 million, due to increased sales of cable and
cable modem products of 20% due to strong customer market demand, and increased sales of video systems
products of 1%.
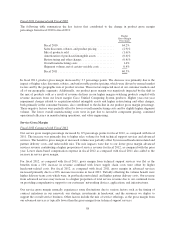
Wireless
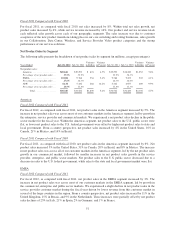
Fiscal 2012 Compared with Fiscal 2011
For fiscal 2012, as compared with fiscal 2011, sales of Wireless products increased by 19%, or $272 million.
These increases reflect the continued customer adoption of and migration to the Cisco Unified Wireless Network
architecture and new product performance.
Fiscal 2011 Compared with Fiscal 2010
Sales of Wireless products increased by 26%, or $293 million, which was primarily due to continued customer
adoption of and migration to the Cisco Unified Wireless Network architecture.
Security
Fiscal 2012 Compared with Fiscal 2011
For fiscal 2012, as compared with fiscal 2011, sales of Security products increased by 12%, or $149 million.
These increases were primarily due to growth in our network security products driven by the recent update of our
firewall security product portfolio.
Fiscal 2011 Compared with Fiscal 2010
For fiscal 2011, sales of Security products decreased by 8%, or $102 million. Our decreased sales of Security
products were the result of lower sales of module and line cards related to our routers and LAN switches,
partially offset by increased sales of our web and email security products.
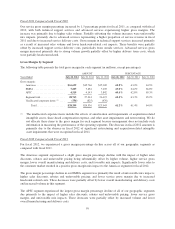
Data Center
Fiscal 2012 Compared with Fiscal 2011
For fiscal 2012, as compared with fiscal 2011, sales of Data Center products increased by 87%, or $604 million,
due to increased sales of Cisco Unified Computing System products. The increase was due to the momentum we
are experiencing with our products for the enterprise and service provider data center and cloud environments, as
current customers increase their data center build out, and new customer product purchases.
To the extent our data center business grows and further penetrates the market, we expect that, in comparison to
what we experienced during the initial rapid growth of this business, the growth rates for our data center product
sales will experience more normal seasonality consistent with the overall server market.
Fiscal 2011 Compared with Fiscal 2010
Sales of Data Center products increased by 254%, or $498 million, due to sales growth of over 273%, or $496
million, of Cisco Unified Computing System products.
Other Products
The decrease in sales of Other Products for fiscal 2012 and 2011 as compared with the prior fiscal year compare
periods was primarily due to lower sales of Flip Video camera products in connection with our decision in fiscal
2011 to exit this consumer product line.
55