Cisco 2003 Annual Report Download - page 39
Download and view the complete annual report
Please find page 39 of the 2003 Cisco annual report below. You can navigate through the pages in the report by either clicking on the pages listed below, or by using the keyword search tool below to find specific information within the annual report.-
 1
1 -
2
-
3
-
4
-
5
-
6
-
7
-
8
-
9
-
10
-
11
-
12
-
13
-
14
-
15
-
16
-
17
-
18
-
19
-
20
-
21
-
22
-
23
-
24
-
25
-
26
-
27
-
28
-
 29
29 -
 30
30 -
 31
31 -
 32
32 -
 33
33 -
 34
34 -
 35
35 -
 36
36 -
 37
37 -
 38
38 -
 39
39 -
 40
40 -
 41
41 -
 42
42 -
 43
43 -
 44
44 -
 45
45 -
 46
46 -
 47
47 -
 48
48 -
 49
49 -
50
-
51
-
52
-
53
-
54
-
55
-
56
-
57
-
58
-
59
-
60
-
61
-
62
-
63
-
64
-
65
-
66
-
67
-
68
 |
 |

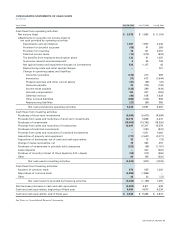
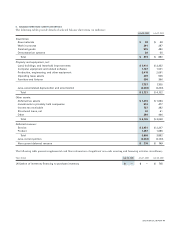
Years Ended July 26, 2003 July 27, 2002 July 28, 2001
Cash flows from operating activities:
Net income (loss) $3,578 $1,893 $ (1,014)
Adjustments to reconcile net income (loss) to
net cash provided by operating activities:
Depreciation and amortization 1,591 1,957 2,236
Provision for doubtful accounts (59) 91 268
Provision for inventory 70 131 2,057
Deferred income taxes (14) (573) (924)
Tax benefits from employee stock option plans 132 61 1,397
In-process research and development 453 739
Net (gains) losses and impairment charges on investments 520 1,127 43
Restructuring costs and other special charges ——501
Change in operating assets and liabilities:
Accounts receivable (125) 270 569
Inventories (17) 673 (1,644)
Prepaid expenses and other current assets (61) (28) (25)
Accounts payable 35 (174) (105)
Income taxes payable (125) 389 (434)
Accrued compensation 104 307 (256)
Deferred revenue (84) 678 1,629
Other accrued liabilities (282) (204) 969
Restructuring liabilities (27) (64) 386
Net cash provided by operating activities 5,240 6,587 6,392
Cash flows from investing activities:
Purchases of short-term investments (9,396) (5,473) (4,594)
Proceeds from sales and maturities of short-term investments 10,319 5,868 4,370
Purchases of investments (18,063) (15,760) (18,306)
Proceeds from sales and maturities of investments 12,497 15,317 15,579
Purchases of restricted investments —(291) (941)
Proceeds from sales and maturities of restricted investments —1,471 1,082
Acquisition of property and equipment (717) (2,641) (2,271)
Acquisition of businesses, net of cash and cash equivalents 33 16 (13)
Change in lease receivables, net 79 380 457
Purchases of investments in privately held companies (223) (58) (1,161)
Lease deposits —320 (320)
Purchase of minority interest of Cisco Systems, K.K. (Japan) (59) (115) (365)
Other 94 159 (520)
Net cash used in investing activities (5,436) (807) (7,003)
Cash flows from financing activities:
Issuance of common stock 578 655 1,262
Repurchase of common stock (5,984) (1,854) —
Other 43 30 (12)
Net cash (used in) provided by financing activities (5,363) (1,169) 1,250
Net (decrease) increase in cash and cash equivalents (5,559) 4,611 639
Cash and cash equivalents, beginning of fiscal year 9,484 4,873 4,234
Cash and cash equivalents, end of fiscal year $3,925 $9,484 $ 4,873
See Notes to Consolidated Financial Statements.
2003 ANNUAL REPORT 37
CONSOLIDATED STATEMENTS OF CASH FLOWS
(In millions)