Cisco 2003 Annual Report Download - page 28
Download and view the complete annual report
Please find page 28 of the 2003 Cisco annual report below. You can navigate through the pages in the report by either clicking on the pages listed below, or by using the keyword search tool below to find specific information within the annual report.-
 1
1 -
2
-
3
-
4
-
5
-
6
-
7
-
8
-
9
-
10
-
11
-
12
-
13
-
14
-
15
-
16
-
17
-
 18
18 -
 19
19 -
 20
20 -
 21
21 -
 22
22 -
 23
23 -
 24
24 -
 25
25 -
 26
26 -
 27
27 -
 28
28 -
 29
29 -
 30
30 -
 31
31 -
 32
32 -
 33
33 -
 34
34 -
 35
35 -
 36
36 -
 37
37 -
 38
38 -
39
-
40
-
41
-
42
-
43
-
44
-
45
-
46
-
47
-
48
-
49
-
50
-
51
-
52
-
53
-
54
-
55
-
56
-
57
-
58
-
59
-
60
-
61
-
62
-
63
-
64
-
65
-
66
-
67
-
68
 |
 |

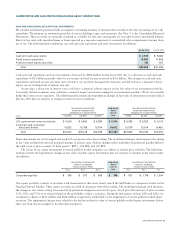
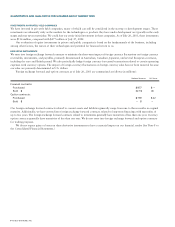
DISCUSSION OF FISCAL 2002 AND 2001
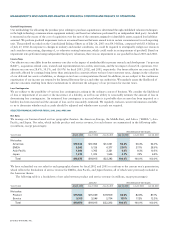
Net Sales
Net sales in fiscal 2002 decreased by $3.4 billion or 15.2% from $22.3 billion in fiscal 2001 to $18.9 billion, primarily related to a
decrease in net product sales. The decrease in net product sales was due to unfavorable global economic conditions and reduced levels
of information technology-related capital spending compared with fiscal 2001. The economic slowdown has had a significant impact
on the telecommunications industry, in particular service provider customers.
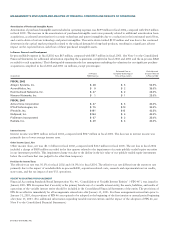
Net Product Sales by Theater
Net product sales in the Americas theater decreased by $1.7 billion or 17.3% from $10.0 billion in fiscal 2001 to $8.3 billion in
fiscal 2002. The decrease was primarily related to the decline in net product sales in the service provider market, in particular the
incumbent local exchange carrier (ILEC) and interexchange carrier (IXC) sectors. The slowdown in the U.S. economy, over-capacity,
changes in the service provider market, and constraints on information technology-related capital spending had a significant adverse
effect on many of our service provider customers. The enterprise market experienced a lower decrease in net product sales compared
with the service provider market primarily because of the need for large corporations, specifically in the manufacturing, health-care,
education, and retail sectors, as well as the U.S. government, to maintain their networks.
Net product sales in EMEA in fiscal 2002 decreased by $1.4 billion or 23.1% from $5.9 billion in fiscal 2001 to $4.5 billion.
Similar to the Americas theater, the decrease in net product sales was related to the slowdown in the European telecommunications
sector and the enterprise market due to companies closely managing their capital spending.
Net product sales in Asia Pacific in fiscal 2002 decreased by $600 million or 27.4% from $2.2 billion in fiscal 2001 to $1.6 billion.
The decrease was primarily related to the decline in net product sales in the enterprise and service provider markets, in particular the
service provider market in China, which experienced increased consolidation and restructuring.
Net product sales in Japan in fiscal 2002 decreased by $196 million or 13.4% from $1.5 billion in fiscal 2001 to $1.3 billion. The
decrease was primarily related to contraction in the electronics sector partially offset by net product sales to the government sector.
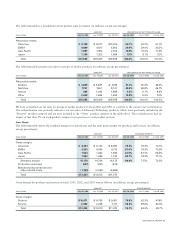
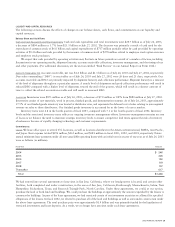
Net Product Sales by Groups of Similar Products
Net product sales related to routers decreased by $1.6 billion or 22.7% from $7.1 billion in fiscal 2001 to $5.5 billion, primarily due to
decreases in sales of our high-end and edge routers. Net product sales related to switches experienced a decrease of $1.5 billion or 16.3%
from $9.1 billion in fiscal 2001 to $7.7 billion, primarily due to decreases in sales of our modular LAN and WAN multiservice switches.
Net product sales related to access products decreased by $827 million or 44.2% from $1.9 billion in fiscal 2001 to $1.0 billion,
primarily due to decreases in sales of our access concentrators and DSL access multiplexer (DSLAM) products.
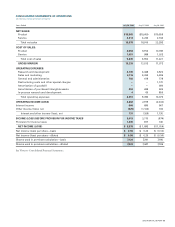
Net Service Revenue
Net service revenue in fiscal 2002 increased by $512 million or 18.7% from $2.7 billion in fiscal 2001 to $3.2 billion. The increase
in net service revenue was primarily related to technical support services, which provide maintenance and problem resolution services
for our products. In addition, revenue from consultative support of our technologies for specific customer networking needs increased.
During fiscal 2002, technical support service contract renewals associated with product sales increased, compared with the prior
fiscal year.
Gross Margin
Gross margin in fiscal 2002 was 63.5%, compared with 49.7% in fiscal 2001.
Product Gross Margin
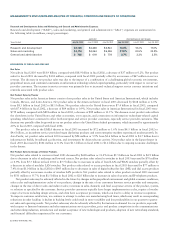
The increase in product gross margin from 47.9% in fiscal 2001 to 62.3% in fiscal 2002 was primarily related to the effect of a
charge for additional excess inventory of $2.2 billion recorded in the third quarter of fiscal 2001 and benefits recognized thereafter
as described below. Excluding the additional excess inventory charge and the subsequent benefits, there was a slight increase in
product gross margin that was primarily due to lower component costs that were partially offset by lower shipment volumes.
Because of a sudden and significant decrease in demand for our products in the third quarter of fiscal 2001, inventory levels
exceeded our estimated requirements based on demand forecasts, and an additional excess inventory charge of $2.2 billion, which
included an additional liability for purchase commitments, was recorded in accordance with our accounting policy. In fiscal 2002, the
provision for inventory and the additional liability for purchase commitments were reduced by a $525 million benefit related to
inventory used to manufacture products sold in excess of our expectations and the settlement of purchase commitments for less than
the estimated amount previously included as part of the additional excess inventory charge.
26 CISCO SYSTEMS, INC.
MANAGEMENT’S DISCUSSION AND ANALYSIS OF FINANCIAL CONDITION AND RESULTS OF OPERATIONS