Circuit City 2006 Annual Report Download - page 19
Download and view the complete annual report
Please find page 19 of the 2006 Circuit City annual report below. You can navigate through the pages in the report by either clicking on the pages listed below, or by using the keyword search tool below to find specific information within the annual report.
Results of Operations
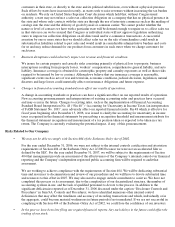
We had net income of $45.1 million for the year ended December 31, 2006, $11.4 million for the year ended
December 31, 2005 and $10.2 million for the year ended December 31, 2004.
The following table represents our consolidated statement of operations data expressed as a percentage of net sales for our
three most recent fiscal years:
NET SALES
Net sales were $2.35 billion for the year ended December 31, 2006, an increase of 10.9% from $2.12 billion for the
year ended December 31, 2005. Net sales in 2006 included approximately $819 million of internet-related sales, an increase
of $169 million, or 26%, from 2005. North American sales increased to $1.6 billion, a 12.7% increase from $1.42 billion in
2005. The increase in North American sales resulted primarily from growth in both our Technology Products and our
Industrial Products segments. Sales in our Technology Products segment increased 12.8% to $1.40 billion from $1.25 billion
in 2005. This increase was largely a result of our successful internet-based marketing initiatives directed primarily at our
consumer customers as reflected by an increase in our internet-related sales of approximately $169 million as well as an
expansion of product offerings including private label products. Although our internet-related sales are not exclusively made
to consumers, we believe that a large majority of these sales are made to consumers. We continued to see strong growth in
our industrial product sales in 2006. Sales of industrial products increased 12.8% to $196.9 million from $174.6 million last
year, representing 12.2% of the overall increase in North American sales. European sales, stated in US dollars, increased
7.1% to $743.9 million for 2006 (representing 31.7% of worldwide sales) compared to $694.6 million (representing 32.8% of
worldwide sales) in the year-ago period. Movements in foreign exchange rates negatively impacted European sales for 2006
by approximately $.4 million. Sales in our Hosted Software segment were not material in 2006.
European economies began to recover during 2006 and we saw our sales improve in those markets as measured in
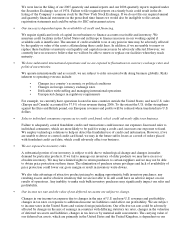
local currencies. The table below reflects European sales for the three years as reported in this report at then-
current exchange
rates and at constant (2004) exchange rates (in millions):
Net sales were $2.12 billion for the year ended December 31, 2005, an increase of 9.7% from $1.93 billion for the year
ended December 31, 2004. Net sales in 2005 included approximately $650 million of internet-related sales, an increase of
$135 million, or 26%, from 2004. North American sales increased to $1.42 billion in 2005, a 15.3% increase from 2004‘s
$1.23 billion. The increase in North American sales resulted primarily from growth in both our Technology Products and our
Industrial Products segments. Sales in our Technology Products segment increased 15.3% to $1.25 billion from $1.08 billion
in 2004. This increase was largely a result of our successful internet-based marketing initiatives directed primarily at our
consumer customers as reflected by an increase in our internet-related sales of approximately $100 million. Although our
internet-related sales are not exclusively made to consumers, we believe that a large majority of these sales are made to
consumers. We continued to see strong growth in our industrial product sales in 2005. Sales of industrial products increased
15.2% to $174.6 million from $151.6 million in 2004, representing 12% of the overall increase in North American sales.
European sales, stated in US dollars, decreased 0.2% to $694.6 million for 2005 (representing 32.8% of worldwide sales)
compared to $695.7 million (representing 36.1% of worldwide sales) in 2004. Movements in foreign exchange rates
positively impacted European sales for 2005 by approximately $5.8 million. If currency exchange rates for 2004 had
•
Net Income: 45.1 million, up 295% from 2005
•
Diluted Earnings Per Share: $1.22 up 294% from 2005
2006
2005
2004
Net sales
100%
100.0%
100.0%
Gross profit
14.6%
14.5%
14.9%
Selling, general and administrative expenses
12.0%
12.7%
13.5%
Restructuring and other charges
–
0.2%
0.4%
Income from operations
2.6%
1.6%
1.0%
Interest expense
0.1%
0.1%
0.2%
Provision for income taxes
1.1%
1.0%
0.3%
Net income
1.9%
0.5%
0.5%
2006
2005
2004
European sales as reported
$743.9
$694.6
$695.7
European sales at 2004 exchange rates
$738.1
$688.8
$695.7


