Chrysler 2011 Annual Report Download - page 227
Download and view the complete annual report
Please find page 227 of the 2011 Chrysler annual report below. You can navigate through the pages in the report by either clicking on the pages listed below, or by using the keyword search tool below to find specific information within the annual report.-
 1
1 -
2
-
3
-
4
-
5
-
6
-
7
-
8
-
9
-
10
-
11
-
12
-
13
-
14
-
15
-
16
-
17
-
18
-
19
-
20
-
21
-
22
-
23
-
24
-
25
-
26
-
27
-
28
-
29
-
30
-
31
-
32
-
33
-
34
-
35
-
36
-
37
-
38
-
39
-
40
-
41
-
42
-
43
-
44
-
45
-
46
-
47
-
48
-
49
-
50
-
51
-
52
-
53
-
54
-
55
-
56
-
57
-
58
-
59
-
60
-
61
-
62
-
63
-
64
-
65
-
66
-
67
-
68
-
69
-
70
-
71
-
72
-
73
-
74
-
75
-
76
-
77
-
78
-
79
-
80
-
81
-
82
-
83
-
84
-
85
-
86
-
87
-
88
-
89
-
90
-
91
-
92
-
93
-
94
-
95
-
96
-
97
-
98
-
99
-
100
-
101
-
102
-
103
-
104
-
105
-
106
-
107
-
108
-
109
-
110
-
111
-
112
-
113
-
114
-
115
-
116
-
117
-
118
-
119
-
120
-
121
-
122
-
123
-
124
-
125
-
126
-
127
-
128
-
129
-
130
-
131
-
132
-
133
-
134
-
135
-
136
-
137
-
138
-
139
-
140
-
141
-
142
-
143
-
144
-
145
-
146
-
147
-
148
-
149
-
150
-
151
-
152
-
153
-
154
-
155
-
156
-
157
-
158
-
159
-
160
-
161
-
162
-
163
-
164
-
165
-
166
-
167
-
168
-
169
-
170
-
171
-
172
-
173
-
174
-
175
-
176
-
177
-
178
-
179
-
180
-
181
-
182
-
183
-
184
-
185
-
186
-
187
-
188
-
189
-
190
-
191
-
192
-
193
-
194
-
195
-
196
-
197
-
198
-
199
-
200
-
201
-
202
-
203
-
204
-
205
-
206
-
207
-
208
-
209
-
210
-
211
-
212
-
213
-
214
-
215
-
216
-
 217
217 -
 218
218 -
 219
219 -
 220
220 -
 221
221 -
 222
222 -
 223
223 -
 224
224 -
 225
225 -
 226
226 -
 227
227 -
 228
228 -
 229
229 -
 230
230 -
 231
231 -
 232
232 -
 233
233 -
 234
234 -
 235
235 -
 236
236 -
 237
237 -
238
-
239
-
240
-
241
-
242
-
243
-
244
-
245
-
246
-
247
-
248
-
249
-
250
-
251
-
252
-
253
-
254
-
255
-
256
-
257
-
258
-
259
-
260
-
261
-
262
-
263
-
264
-
265
-
266
-
267
-
268
-
269
-
270
-
271
-
272
-
273
-
274
-
275
-
276
-
277
-
278
-
279
-
280
-
281
-
282
-
283
-
284
-
285
-
286
-
287
-
288
-
289
-
290
-
291
-
292
-
293
-
294
-
295
-
296
-
297
-
298
-
299
-
300
-
301
-
302
-
303
-
304
-
305
-
306
-
307
-
308
-
309
-
310
-
311
-
312
-
313
-
314
-
315
-
316
-
317
-
318
-
319
-
320
-
321
-
322
-
323
-
324
-
325
-
326
-
327
-
328
-
329
-
330
-
331
-
332
-
333
-
334
-
335
-
336
-
337
-
338
-
339
-
340
-
341
-
342
-
343
-
344
-
345
-
346
-
347
-
348
-
349
-
350
-
351
-
352
-
353
-
354
-
355
-
356
-
357
-
358
-
359
-
360
-
361
-
362
-
363
-
364
-
365
-
366
-
367
-
368
-
369
-
370
-
371
-
372
-
373
-
374
-
375
-
376
-
377
-
378
-
379
-
380
-
381
-
382
-
383
-
384
-
385
-
386
-
387
-
388
-
389
-
390
-
391
-
392
-
393
-
394
-
395
-
396
-
397
-
398
-
399
-
400
-
401
-
402
 |
 |

Consolidated
Financial
Statements
at 31 December
2011
Notes
226
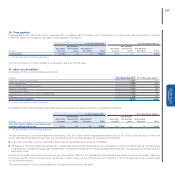
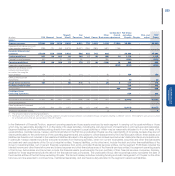
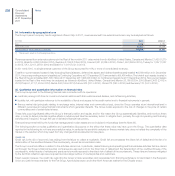
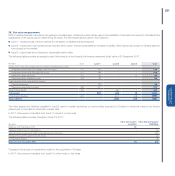
34. Information by geographical area
The Group’s parent company has its registered office in Italy. In 2011, revenues earned from external customers may be analysed as follows:
(€ million) 2011 2010 (*)
Italy 9,258 9,782
Rest of the world 50,301 26,098
Total revenues from external customers 59,559 35,880
(*) The amounts relate to Continuing Operations.
Revenues earned from external customers in the Rest of the world in 2011 arise mainly from (in €million): United States, Canada and Mexico 21,423 (1,270
in 2010), Brazil for 9,860 (9,246 in 2010), Germany 3,158 (2.739 in 2010), France 2,251 (2,244 in 2010), China 1,557 (602 in 2010), Turkey for 1,357 (1,247
in 2010), UK 1,321 (1,261 in 2010) and Spain for 1,019 (1,021 in 2010).
In 2011 and 2010, no single external customer of the Group accounted for 10% or more of consolidated revenues.
Total Non-current assets located in Italy (excluding financial assets, deferred tax assets and defined benefit assets) totalled €9,569 million at 31 December
2011; the corresponding amount classified as Continuing Operations at 31 December 2010 amounted to €9,490 million. The total of such assets located in
the Rest of the world totalled €31,360 million at 31 December 2011 (€6,005 million for Continuing Operations at 31 December 2010). Non-current assets
located in the Rest of the world may be analysed as follows (in €million): United States, Canada and Mexico 25,165 (320 in 2010) Brazil 2,463 (2,412 in
2010) Poland 1,511 (1,612 in 2010) Serbia 463 (100 in 2010) France 322 (331 in 2010), China 272 (180 in 2010) and Germany 170 (157 in 2010).
35. Qualitative and quantitative information on financial risks
The Group is exposed to the following financial risks connected with its operations:
credit risk, arising both from its normal commercial relations with final customers and dealers, and its financing activities;
liquidity risk, with particular reference to the availability of funds and access to the credit market and to financial instruments in general;
finance market risk (principally relating to exchange rates, interest rates and commodity prices), since the Group operates at an international level in
different currencies and uses financial instruments which generate interests. The Group is also exposed to the risk of changes in the price of certain
commodities and of certain listed shares.
These risks could significantly affect the Group’s financial position and results, and for this reason the Group systematically identifies, and monitors these
risks, in order to detect potential negative effects in advance and take the necessary action to mitigate them, primarily through its operating and financing
activities and if required, through the use of derivative financial instruments.
Financial instruments held by the funds that manage pension plan assets are not included in this analysis (see the Note 26).
The following section provides qualitative and quantitative disclosures on the effect that these risks may have upon the Group. The quantitative data
reported in the following do not have any predictive value, in particular the sensitivity analysis on finance market risks does not reflect the complexity of the
market or the reaction which may result from any changes that are assumed to take place.
Credit risk
Credit risk is the risk of economic loss arising from the failure to collect a receivable. Credit risk encompasses the direct risk of default and the risk of a
deterioration of the creditworthiness of the counterparty, as well as concentration risks.
The Group’s credit risk differs in relation to the activities carried out. In particular, dealer financing and operating and financial lease activities that are carried
out through the Group’s financial services companies are exposed both to the direct risk of default and the deterioration of the creditworthiness of the
counterparty, while the sale of vehicles and spare parts is mostly exposed to the direct risk of default of the counterparty. These risks are however mitigated
by the fact that collection exposure is spread across a large number of counterparties and customers.
Taken overall, however, the credit risk regarding the Group’s trade receivables and receivables from financing activities is concentrated in the European
Union and Latin America markets for the Fiat Group Automobiles sector and in the North American market for the Chrysler sector.