Chesapeake Energy 2010 Annual Report Download - page 17
Download and view the complete annual report
Please find page 17 of the 2010 Chesapeake Energy annual report below. You can navigate through the pages in the report by either clicking on the pages listed below, or by using the keyword search tool below to find specific information within the annual report.-
 1
1 -
 2
2 -
 3
3 -
 4
4 -
 5
5 -
 6
6 -
 7
7 -
 8
8 -
 9
9 -
 10
10 -
 11
11 -
 12
12 -
 13
13 -
 14
14 -
 15
15 -
 16
16 -
 17
17 -
 18
18 -
 19
19 -
 20
20 -
 21
21 -
 22
22 -
 23
23 -
 24
24 -
 25
25 -
 26
26 -
 27
27 -
 28
28 -
 29
29 -
 30
30 -
 31
31 -
 32
32 -
 33
33 -
 34
34 -
 35
35 -
 36
36 -
 37
37 -
 38
38 -
 39
39 -
 40
40 -
 41
41 -
 42
42 -
 43
43 -
 44
44 -
 45
45 -
 46
46 -
 47
47 -
 48
48 -
 49
49 -
 50
50 -
 51
51 -
 52
52 -
 53
53 -
 54
54 -
 55
55 -
 56
56 -
 57
57 -
 58
58 -
 59
59 -
 60
60 -
 61
61 -
 62
62 -
 63
63 -
 64
64 -
 65
65 -
 66
66 -
 67
67 -
 68
68 -
 69
69 -
 70
70 -
 71
71 -
 72
72 -
 73
73 -
 74
74 -
 75
75 -
 76
76 -
 77
77 -
 78
78 -
 79
79 -
 80
80 -
 81
81 -
 82
82 -
 83
83 -
 84
84 -
 85
85 -
 86
86 -
 87
87 -
 88
88 -
 89
89 -
 90
90 -
 91
91 -
 92
92 -
 93
93 -
 94
94 -
 95
95 -
 96
96 -
 97
97 -
 98
98 -
 99
99 -
 100
100 -
 101
101 -
 102
102 -
 103
103 -
 104
104 -
 105
105 -
 106
106 -
 107
107 -
 108
108 -
 109
109 -
 110
110 -
 111
111 -
 112
112 -
 113
113 -
 114
114 -
 115
115 -
 116
116 -
 117
117 -
 118
118 -
 119
119 -
 120
120 -
 121
121 -
 122
122 -
 123
123 -
 124
124 -
 125
125 -
 126
126 -
 127
127 -
 128
128 -
 129
129 -
 130
130 -
 131
131 -
 132
132 -
 133
133 -
 134
134 -
 135
135 -
 136
136 -
 137
137 -
 138
138 -
 139
139 -
 140
140 -
 141
141 -
 142
142 -
 143
143 -
 144
144 -
 145
145 -
 146
146 -
 147
147 -
 148
148 -
 149
149 -
 150
150 -
 151
151 -
 152
152 -
 153
153 -
 154
154 -
 155
155 -
 156
156 -
 157
157 -
 158
158 -
 159
159 -
 160
160 -
 161
161 -
 162
162 -
 163
163 -
 164
164 -
 165
165 -
 166
166 -
 167
167 -
 168
168 -
 169
169 -
 170
170 -
 171
171 -
 172
172 -
 173
173 -
 174
174 -
 175
175 -
 176
176 -
 177
177 -
 178
178 -
 179
179 -
 180
180 -
 181
181 -
 182
182 -
 183
183 -
 184
184 -
 185
185 -
 186
186 -
 187
187 -
 188
188 -
 189
189 -
 190
190 -
 191
191 -
 192
192
 |
 |

AMERICA’S PREMIER
ENERGY RESOURCE BASE »
16 | OPERATING AREAS
1
2
3
4
8
7
6
5
Marcellus Shale
Barnett Shale
Haynesville
Shale
Bossier
Shale
Eagle Ford
Shale
Anadarko
Basin
Rockies
Permian
Basin
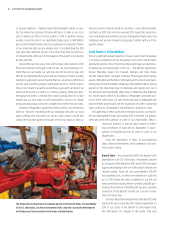
Chesapeake is the second-largest producer of U.S. natural gas and a Top 15 producer of U.S. oil and natural gas liquids. The company has
built a large resource base of high-quality U.S. assets in the Barnett, Haynesville, Bossier, Marcellus and Pearsall natural gas shale plays
and in the Granite Wash, Cleveland, Tonkawa, Mississippian, Bone Spring, Avalon, Wolfcamp, Wolfberry, Eagle Ford, Niobrara and Utica
unconventional liquids plays. In 2010 Chesapeake increased its focus on applying the geoscientific and horizontal drilling expertise
gained from developing unconventional natural gas shale plays to unconventional liquids-rich plays. Our goal is to reach a balanced mix of
natural gas and liquids revenue as quickly as possible through organic drilling. We invested approximately $4.7 billion in 2010, net of
divestitures, primarily in liquids-rich acreage to provide the foundation for this shift toward more profitable plays.
We own interests in approximately 46,000 producing natural gas and oil wells, and in 2010 we produced approximately 1.035 trillion
cubic feet of natural gas equivalent (tcfe) for an average of 2.8 billion cubic feet of natural gas equivalent (bcfe) per day. At year-end
2010, our proved reserves were 17.1 trillion cubic feet of natural gas equivalent, of which 90% were natural gas and all were onshore in the
U.S. We have also captured an inventory of up to 115,000 unrisked net future drilling opportunities — almost 50 years worth of drilling
opportunities — on approximately 13.2 million net leasehold acres in the U.S. The following highlights Chesapeake’s ownership position
in our key operating areas.
Natural Gas Shale Areas
Liquids-Rich Areas
Operating States
