Chesapeake Energy 2009 Annual Report Download - page 4
Download and view the complete annual report
Please find page 4 of the 2009 Chesapeake Energy annual report below. You can navigate through the pages in the report by either clicking on the pages listed below, or by using the keyword search tool below to find specific information within the annual report.-
 1
1 -
 2
2 -
 3
3 -
 4
4 -
 5
5 -
 6
6 -
 7
7 -
 8
8 -
 9
9 -
 10
10 -
 11
11 -
 12
12 -
 13
13 -
 14
14 -
 15
15 -
16
-
17
-
18
-
19
-
20
-
21
-
22
-
23
-
24
-
25
-
26
-
27
-
28
-
29
-
30
-
31
-
32
-
33
-
34
-
35
-
36
-
37
-
38
-
39
-
40
-
41
-
42
-
43
-
44
-
45
-
46
-
47
-
48
 |
 |

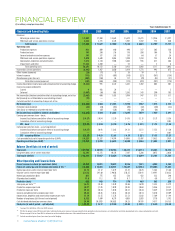
Revenues
Natural gas and oil sales
$ 5,049
$ 7,858 $ 5,624 $ 5,619 $ 3,273 $ 1,936 $ 1,297
Midstream and service operations revenue
2,653
3,771 2,176 1,707 1,392 773 420
Total revenues
$ 7,702 $ 11,629 $ 7,800 $ 7,326 $ 4,665 $ 2,709 $ 1,717
Operating costs
Production expenses
876
889 640 490 317 205 138
Production taxes
107
284 216 176 208 104 78
General and administrative expenses
349
377 243 139 64 37 24
Midstream and service operations expenses
2,498
3,648 2,063 1,590 1,358 755 410
Depreciation, depletion and amortization
1,615
2,144 1,988 1,462 945 611 386
Impairments and other
11,202
2,830 — 55 — 5 6
Total operating costs
16,647
10,172 5,150 3,912 2,892 1,717 1,042
Income (loss) from operations
(8,945 )
1,457 2,650 3,414 1,773 992 675
Other income (expense)
(28 )
(11 ) 15 26 10 5 1
Interest expense
(113 )
(271 ) (401 ) (316 ) (221 ) (167 ) (154 )
Miscellaneous gains (losses)
(202 )
(184 ) 83 117 (70 ) (25 ) (21 )
Total other income (expense)
(343 )
(466 ) (303 ) (173 ) (281 ) (187 ) (174 )
Income (loss) before income taxes and cumulative effect of accounting change
(9,288 )
991 2,347 3,241 1,492 805 501
Income tax expense (benefit):
Current
4
423 29 5 — — 5
Deferred
(3,487 )
(36 ) 863 1,242 545 290 185
Net income (loss) before cumulative effect of accounting change, net of tax
(5,805 )
604 1,455 1,994 947 515 311
Net (income) loss attributable to noncontrolling interest
(25 )
— — — — — —
Cumulative effect of accounting change, net of tax
—
— — — — — 2
Net Income (loss)
$ (5,830 ) $ 604 $ 1,455 $ 1,994 $ 947 $ 515 $ 313
Preferred stock dividends
(23 )
(33 ) (94 ) (89 ) (42 ) (40 ) (22 )
Gain (loss) on redemption of preferred stock
—
(67 ) (128 ) (10 ) (26 ) (36 ) —
Net income (loss) available to common stockholders
$ (5,853 ) $ 504 $ 1,233 $ 1,895 $ 879 $ 439 $ 291
Earnings per common share – basic:
Income (loss) before cumulative effect of accounting change
$ (9.57 )
$
0.94
$
2.70
$
4.76
$
2.73
$
1.73
$
1.36
Cumulative effect of accounting change
—
— — — — — 0.02
EPS – basic
$ (9.57 ) $ 0.94 $ 2.70 $ 4.76 $ 2.73 $ 1.73 $ 1.38
Earnings per common share – assuming dilution:
Income (loss) before cumulative effect of accounting change
$ (9.57 )
$ 0.93 $ 2.63 $ 4.33 $ 2.51 $ 1.53 $ 1.20
Cumulative effect of accounting change
—
— — — — — 0.01
EPS – assuming dilution
$ (9.57 ) $ 0.93 $ 2.63 $ 4.33 $ 2.51 $ 1.53 $ 1.21
Cash provided by (used in) operating activities (GAAP)
$ 4,356
$ 5,357 $ 4,974 $ 4,843 $ 2,407 $ 1,432 $ 939
Operating cash flow (non-GAAP) *
$ 4,333 $ 5,299 $ 4,675 $ 4,040 $ 2,426 $ 1,403 $ 897
Balance Sheet Data (at end of period)
Total assets
$ 29,914
$ 38,593 $ 30,764 $ 24,413 $ 16,114 $ 8,245 $ 4,572
Long-term debt, net of current maturities
12,295
13,175 10,178 7,187 5,286 3,075 2,058
Total equity (deficit)
$ 12,341 $ 17,017 $ 12,624 $ 11,366 $ 6,299 $ 3,163 $ 1,733
Other Operating and Financial Data
Proved reserves in natural gas equivalents (bcfe)
14,254 12,051 10,879 8,956 7,521 4,902 3,169
Future net natural gas and oil revenues discounted at 10% **
$ 9,449 $ 15,601 $ 20,573 $ 13,647 $ 22,934 $ 10,504 $ 7,333
Natural gas price used in reserve report (per mcf)
$ 3.13
$ 5.12 $ 6.19 $ 5.41 $ 8.76 $ 5.65 $ 5.68
Oil price used in reserve report (per bbl) $ 56.72
$ 41.60 $ 90.58 $ 56.25 $ 56.41 $ 39.91 $ 30.22
Natural gas production (bcf)
835
775 655 526 422 322 240
Oil production (mmbbl)
11.8
11.2 9.9 8.7 7.7 6.8 4.7
Production (bcfe)
906 843 714 578 469 363 268
Sales price per mcfe ***
$ 6.22
$ 8.38 $ 8.40 $ 8.86 $ 6.90 $ 5.23 $ 4.79
Production expense per mcfe
$ 0.97
$ 1.05 $ 0.90 $ 0.85 $ 0.68 $ 0.56 $ 0.51
Production taxes per mcfe
$ 0.12
$ 0.34 $ 0.30 $ 0.31 $ 0.44 $ 0.29 $ 0.29
General and administrative expense per mcfe
$ 0.38
$ 0.45 $ 0.34 $ 0.24 $ 0.14 $ 0.10 $ 0.09
Depreciation, depletion and amortization expense per mcfe
$ 1.78
$ 2.55 $ 2.78 $ 2.53 $ 2.02 $ 1.69 $ 1.44
Number of employees (full-time at end of period)
8,152
7,649 6,219 4,883 2,885 1,718 1,192
Cash dividends declared per common share
$ 0.30
$ 0.2925 $ 0.2625 $ 0.23 $ 0.195 $ 0.17 $ 0.135
Stock price (at end of period – split adjusted)
$ 25.88 $ 16.17 $ 39.20 $ 29.05 $ 31.73 $ 16.50 $ 13.58
* See page 13 for definition of this non-GAAP measure.
** PV-10 is the present value (10% discount rate) of estimated future gross revenues to be generated from the production of proved reserves, net of production and future development costs, using assumed prices and costs.
Please see page 129 of our Form 10-K for information on the standardized measure of discounted future net cash flows.
*** Excludes unrealized gains (losses) on natural gas and oil hedging.
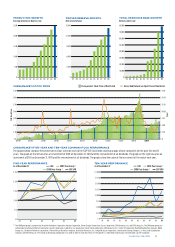
S
tock
p
r
i
c
e
(
a
t
en
d
of
p
er
i
o
d
–
s
plit
adjusted
)
$
25.88
$
1
6.
17
$
39.20
$
29.05
$
3
1
.
7
3
$
1
6.50
$
1
3.58
P
r
oduc
t
ion
(
bcfe
)
9
0
6
843
714
5
7
8
4
6
9
3
6
3
2
68
P
r
o
v
ed
r
ese
rv
es
in
n
a
t
u
r
al
ga
s
e
q
u
i
va
l
ents
(
bcfe
)
14,25
4
12,05
1
1
0,879 8,956
7
,521
4
,902 3,16
9
F
utur
e
net natural
g
a
s
an
d
oil reve
n
ues discounte
d
a
t
1
0%
**
$
9
,44
9
$
15,
601
$
20
,57
3
$
1
3
,
6
47
$
22
,
93
4
$
1
0
,5
0
4
$
7,
333
To
t
al
e
q
u
i
t
y
(
deficit
)
$
12,341
$
17,017
$
12,62
4
$
11,366
$
6,29
9
$
3,16
3
$
1,73
3
T
otal asset
s
$
29
,
9
1
4
$
38
,5
93
$
30
,7
64
$
2
4,41
3
$
1
6
,11
4
$
8
,
2
45
$
4,57
2
O
perating cash
f
low (non-GAAP)
*
$
4,
333
$
5,
299
$
4,
6
75
$
4,
0
4
0
$
2
,4
26
$
1,4
03
$
897
EP
S
–
assum
i
n
g
dil
ut
i
on
$
(
9.5
7
)
$
0.93
$
2.63
$
4
.33
$
2.5
1
$
1
.53
$
1
.2
1
EP
S
– basi
c
$
(9.5
7
)
$
0.94
$
2.
7
0
$
4
.
7
6
$
2.
7
3
$
1
.
7
3
$
1
.38
Net
i
n
co
m
e
(
loss
)
a
v
ailable
t
o
co
mm
on
s
t
ockholde
r
s
$
(5
,
85
3
)
$
50
4
$
1
,
233
$
1
,
895
$
87
9
$
43
9
$
291
Net
I
n
co
m
e
(
loss
)
$
(
5,830
)
$
60
4
$
1
,
455
$
1,994
$
94
7
$
515
$
31
3
T
o
t
al
r
e
v
e
n
ues
$
7,702
$
11,629
$
7,800
$
7,326
$
4,665
$
2,70
9
$
1
,
717
Years Ended December 31
FINANCIAL REVIEW
($ in millions, except per share data)
Financial and Operating Data 2009 2008 2007 2006 2005 2004 2003
1 CHESAPEAKE ENERGY CORPORATION