Chesapeake Energy 2009 Annual Report Download - page 3
Download and view the complete annual report
Please find page 3 of the 2009 Chesapeake Energy annual report below. You can navigate through the pages in the report by either clicking on the pages listed below, or by using the keyword search tool below to find specific information within the annual report.-
 1
1 -
 2
2 -
 3
3 -
 4
4 -
 5
5 -
 6
6 -
 7
7 -
 8
8 -
 9
9 -
 10
10 -
 11
11 -
 12
12 -
 13
13 -
 14
14 -
15
-
16
-
17
-
18
-
19
-
20
-
21
-
22
-
23
-
24
-
25
-
26
-
27
-
28
-
29
-
30
-
31
-
32
-
33
-
34
-
35
-
36
-
37
-
38
-
39
-
40
-
41
-
42
-
43
-
44
-
45
-
46
-
47
-
48
 |
 |

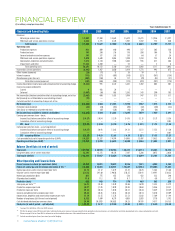
FINANCIAL REVIEW 3
$
0
$
10
$
20
$
30
$
40
$
50
$
60
$
70
$
0
$
2.50
$
5.00
$
7.50
$
10.00
$
12.50
$
15.00
$
17.50
JAN 99 JAN 00 JAN 01 JAN 02 JAN 03 JAN 04 JAN 05 JAN 06 JAN 07 JAN 08 JAN 09
CHK Stock Price
$/mcf
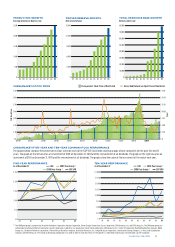
CHESAPEAKE’S STOCK PRICE
Chesapeake’s Stock Price at Month End Henry Hub Natural Gas Spot Price at Month End
(1) The 2009 peer group is comprised of Anadarko Petroleum Corporation, Apache Corporation, Devon Energy Corporation, Encana Corporation, EOG Resources, Inc. and XTO Energy, Inc. The 2008 peer group was
comprised of Anadarko Petroleum Corporation, Apache Corporation, Cabot Oil & Gas Corporation, Devon Energy Corporation, EOG Resources, Inc., Forest Oil Corporation, Newfield Exploration Company, Noble
Energy, Inc., Occidental Petroleum Corporation, Pioneer Natural Resources Company, Quicksilver Resources, Inc., Range Resources Corporation, Southwestern Energy Company, St. Mary Land & Exploration
Company and XTO Energy, Inc. The change in peer group composition was made in order to show the returns of Chesapeake vs. other North American gas-focused large-cap E&P companies.
CHESAPEAKE’S FIVE-YEAR AND TEN-YEAR COMMON STOCK PERFORMANCE
The graphs below compare the performance of our common stock to the S&P 500 Stock Index and two groups of peer companies for the past five and 10
years. The graph on the left assumes an investment of $100 on December 31, 2004 and the reinvestment of all dividends. The graph on the right assumes an
investment of $100 on December 31, 1999 and the reinvestment of all dividends. The graphs show the value of the investment at the end of each year.
99 00 01 02 03 04 05 06 07 08 09
0
10,000
20,000
30,000
40,000
50,000
60,000
70,000
80,000
0
3,000
6,000
9,000
12,000
15,000
99 00 01 02 03 04 05 06 07 08 09
99 00 01 02 03 04 05 06 07 08 09
0
500
1,000
1,500
2,000
2,500
PROVED RESERVE GROWTH
Bcfe at end of year
PRODUCTION GROWTH
Average mmcfe per day for year
TOTAL RESOURCE BASE GROWTH
Bcfe at end of year
$
0
$
500
$
250
$
750
$
1,250
$
1,750
$
1,000
$
1,500
$
2,000
99 0403020100 05 06 07 08 09
$
0
$
50
$
100
$
150
$
200
$
250
04 05 06 07 08 09
FIVE-YEAR PERFORMANCE
As of December 31 CHK 2009 Peer Group(1)
2008 Peer Group(1) S&P 500
TEN-YEAR PERFORMANCE
As of December 31 CHK 2009 Peer Group(1)
2008 Peer Group(1) S&P 500