Chesapeake Energy 2002 Annual Report Download - page 4
Download and view the complete annual report
Please find page 4 of the 2002 Chesapeake Energy annual report below. You can navigate through the pages in the report by either clicking on the pages listed below, or by using the keyword search tool below to find specific information within the annual report.-
 1
1 -
 2
2 -
 3
3 -
 4
4 -
 5
5 -
 6
6 -
 7
7 -
 8
8 -
 9
9 -
 10
10 -
 11
11 -
 12
12 -
 13
13
 |
 |

Letter to Shareholders
The cover to this year’s Annual Report makes clear that
Chesapeake celebrated its tenth anniversary as a public
company in 2002. Despite experiencing extremely
volatile oil and natural gas prices during the past ten
years, Chesapeake has grown from little more than a
start-up to become the eighth largest independent
natural gas producer in the U.S. Along the way,
Chesapeake has delivered a total return to shareholders
of 482%, a Compounded Annual Growth Rate
(CAGR) of 20%.
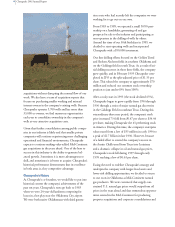
We are especially proud that many of Chesapeake’s
operational results in 2002 were its best ever. The com-
pany ended 2002 with 2.2 trillion cubic feet of gas
equivalent (tcfe)
proved reserves
and produced
181.5 billion
cubic feet of gas
equivalent (bcfe)
during the year.
Both of these
were records and
represented
increases of 24%
and 12%, respectively, over last year’s results.
And, we are already off to a great start in 2003. During
the first quarter of 2003, Chesapeake purchased $830
million of attractively priced, high-quality Mid-
Continent gas reserves from ONEOK, Inc., El Paso
Corporation and Vintage Petroleum, Inc. These pur-
chases ensure that in 2003 Chesapeake will once again
reach record levels of proved reserves and production.
We are currently estimating that the company’s year-
end 2003 proved reserves will exceed 2.75 tcfe, and
2003 production levels should exceed 230 bcfe, both
increases of approximately 25% over 2002’s results.
Chesapeake’s Business Strategy
The driver of Chesapeake’s accomplishments during the
past decade has been the company’s unique focus on
building one of the nation’s largest onshore natural gas
asset bases through balanced programs of deep gas
exploration and opportunistic producing property
acquisitions. The successful execution of this balanced
business strategy has enabled Chesapeake to build
unique economies of scale, an unrivaled backlog of
drilling opportunities and the most accomplished
Mid-Continent team of land, geoscience, engineering
and operations personnel.
Because natural gas has become the fuel of choice to
meet steadily increasing energy demand in the U.S.,
Chesapeake’s focus on natural gas should provide sub-
stantial growth and financial return opportunities for its
shareholders in the years ahead. With an undeveloped
prospect inventory of 2,000 drillsites and further Mid-
Continent consolidation opportunities likely in the
coming years, our goal is to continue increasing
Chesapeake’s proved
reserves, natural gas
production, cash flow
from operations and
earnings per share by at
least 15% per year on
average. We also plan
to continue improving
Chesapeake’s balance
sheet and believe that
further credit rating
agency upgrades are likely as we continue executing the
company’s business strategy.
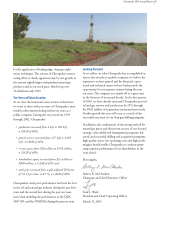
Chesapeake’s Mid-Continent Focus
This strategy includes staying focused on the Mid-
Continent, which is the nation’s third-largest gas supply
region and the location of 90% of Chesapeake’s assets.
Geographically, this area consists of Oklahoma, western
Arkansas, the Texas Panhandle and southwest Kansas.
In this region, Chesapeake is the largest natural gas
producer (with a gas production market share greater
than the combined share of the next two largest pro-
ducers – BP and Apache), the most active driller (by
a 4:1 margin over the second most active driller) and
the most aggressive consolidator of under-exploited
producing assets.
We have a number of reasons for concentrating in this
region. The Mid-Continent is characterized by long-
lived natural gas reserves that have predictable decline
curves, multiple drilling targets that significantly reduce
Chesapeake 2002 Annual Report
2
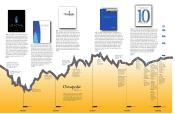
Growth in a $100 Investment Feb. 4, 1993 (CHK IPO date) through March 31, 2003
Chesapeake
$589.50
Peers*
$260.88
Dow Jones $233.91
NASDAQ $189.20
S&P $188.67
126%
152%
212%
212%
CHK Outperforms By:
* Peers = APA, APC, BR, COG, DVN, EOG, FST, KMG, NBL, NFX, OEI, PPP, PXD, VPI, XTO