Chesapeake Energy 2001 Annual Report Download - page 3
Download and view the complete annual report
Please find page 3 of the 2001 Chesapeake Energy annual report below. You can navigate through the pages in the report by either clicking on the pages listed below, or by using the keyword search tool below to find specific information within the annual report.-
 1
1 -
 2
2 -
 3
3 -
 4
4 -
 5
5 -
 6
6 -
 7
7 -
 8
8 -
 9
9 -
 10
10 -
 11
11
 |
 |

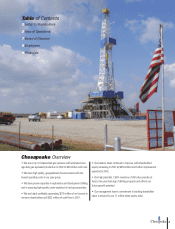
Table of Contents
2 Letter to Shareholders
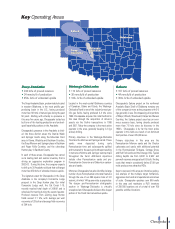
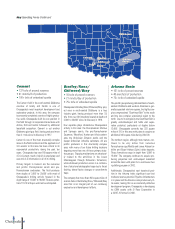
5 Area of Operations
7 Board of Directors
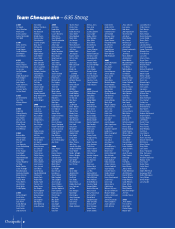
8 Employees
9 Financials
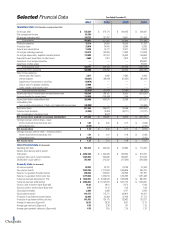
•We are a top 10 independent gas producer with estimated aver-
age daily gas equivalent production in 2002 of 460 million cubic feet.
•We have high quality, geographically focused assets with the
lowest operating costs in our peer group.
•We have proven expertise in exploration and development drilling
and in acquiring high-quality, under-exploited oil and gas properties.
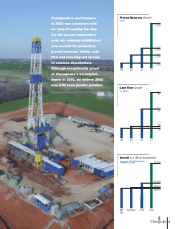
•We are highly profitable, generating $215 million of net income to
common shareholders and $522 million of cash flow in 2001.
•Our balance sheet continues to improve, with shareholders’
equity increasing in 2001 by $454 million and further improvement
expected in 2002.
•Our high potential, 1,500+ inventory of drill sites provides at
least a five-year back log of drilling prospects and affirms our
future growth potential.
•Our management team’s commitment to building shareholder
value is ensured by our 21 million share equity stake.
1
Chesapeake Overview