Chesapeake Energy 1993 Annual Report Download - page 13
Download and view the complete annual report
Please find page 13 of the 1993 Chesapeake Energy annual report below. You can navigate through the pages in the report by either clicking on the pages listed below, or by using the keyword search tool below to find specific information within the annual report.-
 1
1 -
2
-
 3
3 -
 4
4 -
 5
5 -
 6
6 -
 7
7 -
 8
8 -
 9
9 -
 10
10 -
 11
11 -
 12
12 -
 13
13 -
 14
14 -
 15
15 -
 16
16 -
 17
17 -
 18
18 -
 19
19 -
 20
20 -
 21
21 -
 22
22 -
 23
23 -
24
-
25
-
26
-
27
-
28
-
29
-
30
-
31
-
32
-
33
-
34
-
35
-
36
-
37
-
38
-
39
 |
 |

MANAGEMENT'S DISCUSSION AND ANALYSIS OF
FINANCIAL CONDITION AND RESULTS OF OPERATIONS
Overview
General In February 1993, the Company completed an initial public offering of 2,300,000 shares of its
Common Stock. The offering allowed the Company to improve its financial condition through payment of its
obligation to TCW and facilitated its lower cost, long-term lending arrangement with its principal secured
lender, Union Bank. The offering also enabled the Company to increase the rate of development of its
substantial undeveloped oil and gas reserve base.
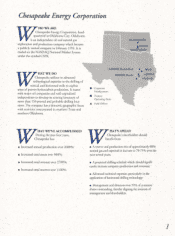
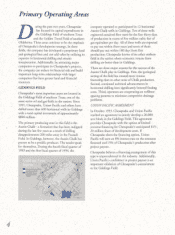
During fiscal 1993,the Company participated in 37 gross wells (7.4 net), of which 32 were operated by
the Company. In its primary development areas, the Giddings and Golden Trend Fields, the Company's finding
costs were approximately $85 per Mcfe, and approximately $1.07 per Mcfe for all areas in 1993: The
Company added an estimated 9.1 net MMcfe of proved developed reserves as a result of this drilling, well in
excess of its 4.3 net MMcfe of production. In fiscal 1993, the Company for the first time produced more
natural gs than equivalent oil.
The following table sets forth certain operating data of the Company for the periods presented:
OPERATING DATA
Year Ended June 30,
1991 1992 1993
Net Production Data:
Oil (MBb1) 163 374 276
Gas (MMcf) 646 1,252 2,677
Gas equivalent (MMcfe) 1,624 3,496 4,333
Oil and Gas Sales (S in 000's):
Oil $3,284 $ 8,170 $ 5,576
Gas 1.050 2,350 6,026
Total oil and gas sales 4,334 10520 11,602
Average Sales Price:
Oil (S per Bbl) $:20.15 5. 21.85 $ 20.20
Gas (S per Mcf) 1.59 1.88 2.25
Oil and Gas Costs ($ per Mcfe):
Production expenses and taxes $.47 $.57 $.60
General and administrative, net 1.30 .98 .90
Depreciation, depletion and amortization .98 .83 .97
Net Wells Drilled:
Horizontal wells 7.7 11.3 3.0
Vertical wells. 7.5 3,7 4.4
Net Wells at End of Period 15.2 29.4 33.1