Chesapeake Energy 1993 Annual Report Download - page 12
Download and view the complete annual report
Please find page 12 of the 1993 Chesapeake Energy annual report below. You can navigate through the pages in the report by either clicking on the pages listed below, or by using the keyword search tool below to find specific information within the annual report.-
 1
1 -
 2
2 -
 3
3 -
 4
4 -
 5
5 -
 6
6 -
 7
7 -
 8
8 -
 9
9 -
 10
10 -
 11
11 -
 12
12 -
 13
13 -
 14
14 -
 15
15 -
 16
16 -
 17
17 -
 18
18 -
 19
19 -
 20
20 -
 21
21 -
 22
22 -
23
-
24
-
25
-
26
-
27
-
28
-
29
-
30
-
31
-
32
-
33
-
34
-
35
-
36
-
37
-
38
-
39
 |
 |

SECTION II
SELECTED FINANCIAL DATA
The following table sets forth selected consolidated financial data of the Company for each of the four
fiscal years ended June30 1993 The data is derived from the financial statements of the Companywhich have
been audited by Price Waterhouse independent accountants The data set forth in this table should be read
in conjunction with Management s Discussion and Analysis of Financial Condition and Results of Operations
and the Consolidated Financial Statements and related notes included elsewhere in this report
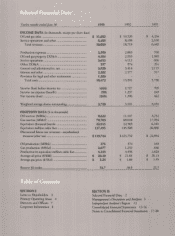
SELECTED FINANCIAL DATA:
Year Ended June 30,
1990 1991 1992 1993
(S in thQusands, excepiper share data)
Statement of Operations Data:
Revenues: ..
Oil and gas sales $389 $ 4,334 $10,520 $11,602
Oil and gas service operations 197 1,961 7,656 5,526
Interest and othe,r 38 148 542 880
Total 624 6443 18718 18008
Costs and expenses:
Production expenses and taxes 43 760 2 003 2 590
Oil and gas service operations 136 606 4 113 3653
Depreciation depletion and amortizatiOn
of oil and gas properties 85 1,585 2 910 4 184
Depreciation and amortization of other assets 126 351 974 557
General and administrative net 759 2 119 3414 3920
Provision for legal and other settlements -1 286
Interest and other 12 317 2 577 2 282
Totalcostsandexpenses 1161 5738 15991 18472
Income (loss) before income taxes (537) 705 2 727 (464)
Income tax expense (benefit) -- 243 1337 (99)
Net income (loss) ($ 537) $462 $ 1 390 ($ 365)
Dividends on preferred stock $''' $-SS38.5
Net incOme (loss) per common share ($ .17) $.15 $ .45 ($ .20)
Cash FlOw Data: -. .,
Cash provided by (used in) operating activities
.
$2 081 $14 821 $ 9 318 (5 1 499)
Cash used in investing activities 1 006 21 928 24 755 15 142
Cash provided by financing activities 133 9 247 12 779 20 802
Balance Sheet Data (at end of period)
Working..capital (deficit) :($1,351) ($15,661) ($24,629) ($11,891)
Total assets .7,492 44,462 60,683 .7,846
Long term debt net of current maturities 289 8 570 21 742 13 190
Stockholders equity (deficit) (655) (1 559) 132 31 432