Charles Schwab 2015 Annual Report Download - page 8
Download and view the complete annual report
Please find page 8 of the 2015 Charles Schwab annual report below. You can navigate through the pages in the report by either clicking on the pages listed below, or by using the keyword search tool below to find specific information within the annual report.-
 1
1 -
 2
2 -
 3
3 -
 4
4 -
 5
5 -
 6
6 -
 7
7 -
 8
8 -
 9
9 -
 10
10 -
 11
11 -
 12
12 -
 13
13 -
 14
14 -
 15
15 -
 16
16 -
 17
17 -
 18
18 -
 19
19 -
20
-
21
-
22
-
23
-
24
-
25
-
26
-
27
-
28
-
29
-
30
-
31
-
32
-
33
-
34
-
35
-
36
-
37
-
38
-
39
-
40
-
41
-
42
-
43
-
44
-
45
-
46
-
47
-
48
-
49
-
50
-
51
-
52
-
53
-
54
-
55
-
56
-
57
-
58
-
59
-
60
-
61
-
62
-
63
-
64
-
65
-
66
-
67
-
68
-
69
-
70
-
71
-
72
-
73
-
74
-
75
-
76
-
77
-
78
-
79
-
80
-
81
-
82
-
83
-
84
-
85
-
86
-
87
-
88
-
89
-
90
-
91
-
92
-
93
-
94
-
95
-
96
-
97
-
98
-
99
-
100
-
101
-
102
-
103
-
104
-
105
-
106
-
107
-
108
-
109
-
110
-
111
-
112
-
113
-
114
-
115
-
116
-
117
-
118
-
119
-
120
-
121
-
122
-
123
-
124
-
125
-
126
-
127
-
128
-
129
-
130
-
131
-
132
-
133
-
134
-
135
-
136
-
137
-
138
-
139
-
140
-
141
-
142
-
143
-
144
-
145
-
146
-
147
-
148
-
149
-
150
 |
 |

6LETTER FROM THE CHIEF EXECUTIVE OFFICER
A potential inection point
Punishing. There is no other way to describe the nancial
impact on our company from the unprecedented
experiments taken by the Federal Reserve since 2008.
While the Fed experimented with zero interest rates and
printing money under the guise of a fancy term–quantitative
easing–savers suffered, responsible people who had
avoided large debt suffered, and our company suffered as
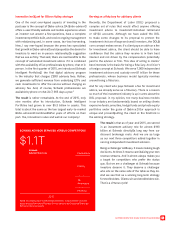
well. In 2008, when client assets at Schwab were slightly in
excess of $1 trillion, we generated revenue of just over $5
billion. In 2015, when client assets were in excess of $2.5
trillion, we generated revenue of just over $6 billion. Put
more succinctly, during that period total client assets grew
by about 120% while revenues grew just 24%. Punishing.
And you can attribute virtually this entire scenario to the
interest rate policies of the Fed.
In order to cope with this, we made many trade-off decisions
to generate reasonable returns for stockholders while we
tried to minimize passing on the pain from the Fed’s actions
to our clients. In just one example, since the beginning of
2009 we waived about $4 billion of management fees from
money market funds to ensure that our clients avoided a
negative yield on their investments in those vehicles.
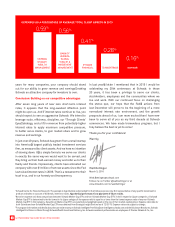
But on December 16, 2015, the Fed increased the federal
funds rate by about 0.25%, beginning what is, hopefully, a
process toward normalizing interest rates–albeit one that
could unfold unevenly over several years. It doesn’t exactly
sound earth-shattering, but given that almost 10 years have
passed since the last rate increase, it is a step in the right
direction. And the impact for our clients and stockholders
should be positive. Clients can expect to begin earning a bit
more interest on their cash and xed income investments,
while stockholders should see an increase in the rate of
revenue growth at Schwab.
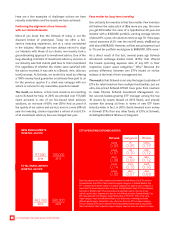
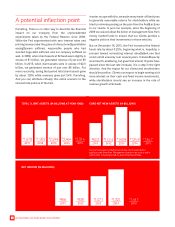
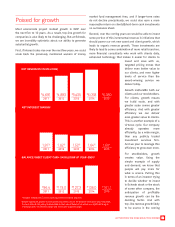
$1,212
2008
$864
2011
$928
2012
$1,071
2013
$1,321
2014
$1,447
2015
NET INCOME (IN MILLIONS)
$1,678
2011
$1,952
2012
$2,249
2013
$2,464
2014
$2,514
2015
$82.3
2011
$112.4
2012
$140.8
2013
$124.8
2014
$134.7
2015
TOTAL CLIENT ASSETS (IN BILLIONS AT YEAR-END) CORE NET NEW ASSETS (IN BILLIONS)
Core net new assets are dened as net new client assets before
signicant one-time ows. Management considers this to be a useful
metric when comparing period-to-period client asset ows.