Charles Schwab 2015 Annual Report Download - page 10
Download and view the complete annual report
Please find page 10 of the 2015 Charles Schwab annual report below. You can navigate through the pages in the report by either clicking on the pages listed below, or by using the keyword search tool below to find specific information within the annual report.-
 1
1 -
 2
2 -
 3
3 -
 4
4 -
 5
5 -
 6
6 -
 7
7 -
 8
8 -
 9
9 -
 10
10 -
 11
11 -
 12
12 -
 13
13 -
 14
14 -
 15
15 -
 16
16 -
 17
17 -
 18
18 -
 19
19 -
 20
20 -
 21
21 -
22
-
23
-
24
-
25
-
26
-
27
-
28
-
29
-
30
-
31
-
32
-
33
-
34
-
35
-
36
-
37
-
38
-
39
-
40
-
41
-
42
-
43
-
44
-
45
-
46
-
47
-
48
-
49
-
50
-
51
-
52
-
53
-
54
-
55
-
56
-
57
-
58
-
59
-
60
-
61
-
62
-
63
-
64
-
65
-
66
-
67
-
68
-
69
-
70
-
71
-
72
-
73
-
74
-
75
-
76
-
77
-
78
-
79
-
80
-
81
-
82
-
83
-
84
-
85
-
86
-
87
-
88
-
89
-
90
-
91
-
92
-
93
-
94
-
95
-
96
-
97
-
98
-
99
-
100
-
101
-
102
-
103
-
104
-
105
-
106
-
107
-
108
-
109
-
110
-
111
-
112
-
113
-
114
-
115
-
116
-
117
-
118
-
119
-
120
-
121
-
122
-
123
-
124
-
125
-
126
-
127
-
128
-
129
-
130
-
131
-
132
-
133
-
134
-
135
-
136
-
137
-
138
-
139
-
140
-
141
-
142
-
143
-
144
-
145
-
146
-
147
-
148
-
149
-
150
 |
 |

8LETTER FROM THE CHIEF EXECUTIVE OFFICER
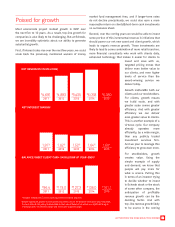
years for many companies, your company should stand
out for our ability to grow revenue and earnings—making
Schwab an attractive company for investors to own.
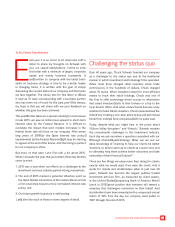
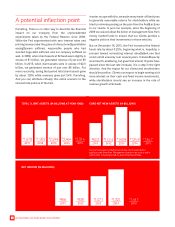
Conclusion: Building on our competitive advantages
After seven long years of near zero short-term interest
rates, it appears that the long-awaited inection point
might be upon us. And if interest rates continue to rise, you
should expect to see an aggressive Schwab. We intend to
leverage scale, efciency, discipline, our “Through Clients’
Eyes” strategy, and a lift in revenue from potentially higher
interest rates to apply maximum competitive pressure,
to better serve clients, to gain market share and to grow
revenue and earnings.
In just over 40 years, Schwab has grown from a small startup
into America’s largest publicly traded investment services
rm, as measured by client assets. And we have no intention
of slowing down. It’s a simple formula: we serve our clients
in exactly the same way we would want to be served, and
they bring us their hard-earned money and refer us to their
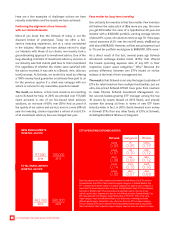
family and friends. Impressively, clients have entrusted our
company with over $1 trillion of net new assets since the Fed
last raised interest rates in 2006. That is a testament to their
trust in us, and in our honesty and transparency.
In last year’s letter I mentioned that in 2015 I would be
celebrating my 20th anniversary at Schwab. In those
20 years, it has been a privilege to serve our clients,
stockholders, employees and the communities where we
live and work. With our continued focus on challenging
the status quo, our hope that the Fed’s actions from
last December will prove to be the beginning of a more
normalized interest rate environment, and the growth
prospects ahead of us, I am more excited than I have ever
been to serve all of you as my third decade at Schwab
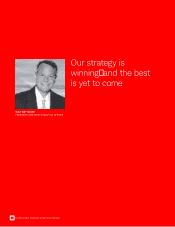
commences. We have made tremendous progress, but I
truly believe the best is yet to come!
Thank you for your condence!
Warmly,
Walt Bettinger
March 3, 2016
Walt.Bettinger@schwab.com
Follow me on Twitter @waltbettinger or at
www.linkedin.com/in/waltbettinger
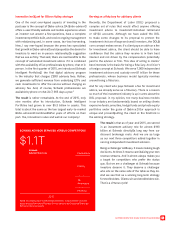
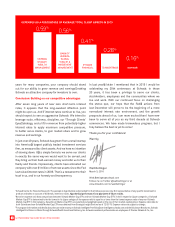
0.59%0.56%
0.41%
0.28%
0.16%
SCHWAB
TD AMERITRADE
E*TRADE
FINANCIAL
BANK OF
AMERICA
GLOBAL
WEALTH &
INVESTMENT
MANAGEMENT
MORGAN
STANLEY
WEALTH
MANAGEMENT
EXPENSES AS A PERCENTAGE OF AVERAGE TOTAL CLIENT ASSETS IN 2015
1
Schwab Center for Financial Research. The example is hypothetical and provided for illustrative purposes only. Not representative of any specic investment or
product and takes no account of dividends, interest or taxes. Hypothetical performance is no guarantee of future results.
2
Based on expense ratio data comparisons between Schwab Market-Cap ETFs and non-Schwab Market-Cap ETFs in their respective Lipper categories. A Schwab
Market-Cap ETF is determined to be the lowest in its Lipper category if its expense ratio is equal to or lower than the lowest expense ratio of any non-Schwab
Market-Cap ETF in that category. Securities in Market-Cap ETFs are selected and weighted based on the size of their market capitalization. Expense ratio data for
both Schwab and non-Schwab Market-Cap ETFs was obtained from Strategic Insight Simfund as of 12/31/15. Expense ratios are subject to change.
3
For program information and details about how we make money on Schwab Intelligent Portfolios™, see intelligent.schwab.com and the Disclosure Brochures. Schwab
Intelligent Portfolios is offered through Schwab Wealth Investment Advisory, Inc. Schwab investment professionals are employees of Charles Schwab & Co., Inc.