Charles Schwab 2014 Annual Report Download - page 12
Download and view the complete annual report
Please find page 12 of the 2014 Charles Schwab annual report below. You can navigate through the pages in the report by either clicking on the pages listed below, or by using the keyword search tool below to find specific information within the annual report.-
 1
1 -
 2
2 -
 3
3 -
 4
4 -
 5
5 -
 6
6 -
 7
7 -
 8
8 -
 9
9 -
 10
10 -
 11
11 -
 12
12 -
 13
13 -
 14
14 -
 15
15 -
 16
16 -
 17
17 -
 18
18 -
 19
19 -
 20
20 -
 21
21 -
 22
22 -
23
-
24
-
25
-
26
-
27
-
28
-
29
-
30
-
31
-
32
-
33
-
34
-
35
-
36
-
37
-
38
-
39
-
40
-
41
-
42
-
43
-
44
-
45
-
46
-
47
-
48
-
49
-
50
-
51
-
52
-
53
-
54
-
55
-
56
-
57
-
58
-
59
-
60
-
61
-
62
-
63
-
64
-
65
-
66
-
67
-
68
-
69
-
70
-
71
-
72
-
73
-
74
-
75
-
76
-
77
-
78
-
79
-
80
-
81
-
82
-
83
-
84
-
85
-
86
-
87
-
88
-
89
-
90
-
91
-
92
-
93
-
94
-
95
-
96
-
97
-
98
-
99
-
100
-
101
-
102
-
103
-
104
-
105
-
106
-
107
-
108
-
109
-
110
-
111
-
112
-
113
-
114
-
115
-
116
-
117
-
118
-
119
-
120
-
121
-
122
-
123
-
124
-
125
-
126
-
127
-
128
-
129
-
130
-
131
-
132
-
133
-
134
-
135
-
136
-
137
-
138
-
139
-
140
 |
 |

Let’s spend some time reviewing how things turned out,
and then we can turn our attention to the nancial picture
for 2015.
Our baseline assumptions for 2014 included a 6.5% rise
in the S&P 500®
, no change in interest rates, and client
trading activity basically growing in line with expected
growth in our client base of 5% to 6%. In that
environment, we expected to achieve mid- to high-single-
digit percentage growth in client assets and revenues;
sustained expense discipline would then help us deliver
a 300–500 basis point gap between revenue and expense
growth and a pre-tax prot margin of around 34%. In
hindsight, our baseline scenario may very well strike you
as conservative, but we should remember that we were
coming off several years of what I’ll call “head fakes”—
initial expectations of sustained economic strengthening
interrupted by potential signs of softening or even
weakness. Those head fakes can be very disruptive to our
investment plans as we remain committed to delivering
protable growth across all environments, so we thought
it advisable not to rely on a stronger environment “lifting”
us out of our spending constraints.
What happened in 2014?
• Equity market returns did indeed show some volatility
during 2014 as the economic picture unfolded, but the
recovery held and the S&P 500 rose more than 11%
overall, helping client asset valuations and asset
management and administration fees top our expectations.
• Interest rates were more or less a mixed bag during
the year, with short-term rates mainly in a holding
pattern and long-term rates popping up early and then
dropping amid fresh concerns around a global economic
slowdown and general “risk-off” sentiment. Our net
interest revenue benetted from some timely xed-rate
asset purchases early in the year, as well as higher-
than-expected loan balances.
• Revenue trades did not grow in line with the client base,
but came close enough to keep trading revenue almost
at from year to year.
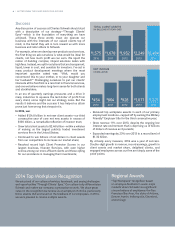
• Finally, our $124.8 billion in net new assets were right in
line with our expectations for the year.
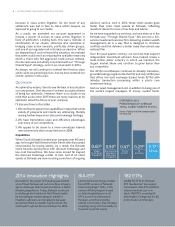
Taking these factors together, we exceeded all of our initial
nancial expectations for 2014. The environment and our
continued success with clients helped two of our three
main revenue sources—asset management fees and net
interest revenue—surpass initial estimates and pushed
overall revenue growth to approximately 11%. By staying
focused on operating efciency, we were able to limit
expense growth to approximately 6% even while investing
a record $188 million in client-related projects, thereby
achieving a revenue/expense growth gap of nearly 580
basis points and a pre-tax prot margin of 34.9%, up from
31.4% in 2013.
We think you’ll agree these are impressive results. So now
comes the obvious question—Are we there yet? As we
enter 2015, has our journey brought us to the point where
we should expect to consistently deliver strong revenue
growth tied to growth in our client base, and then achieve
earnings growth meaningfully ahead of that revenue
expansion? In short, are we as protable as we can be?
The honest answer is that all three basic responses—
yes, no, and maybe—are equally valid at this point in our
progress. Let’s take them in turn.
Yes
As long as the economic environment is stable or
improving, we rmly believe that our strategy and business
model will enable us to attract a growing share of investable
assets in the United States, and then build revenues from
that growth while offering our products and services at a
great value. We also believe we possess the experience
and discipline to intelligently balance our investments to
drive growth with near-term protability, and to manage
expense growth below that of revenues. We’ve been
focused on this for many years, and frankly our “sideways”
experience of 2009–2012 was the anomaly—with so much
of our revenue taken away by ultra-low interest rates, our
balancing act forced us to hold off on improving operating
leverage in order to invest appropriately and deliver
still-solid protability. So yes, as 2014 demonstrated, with
10% client asset growth, 11% revenue growth versus 6%
10 / LETTER FROM THE CHIEF FINANCIAL OFFICER