CenturyLink 2011 Annual Report Download - page 4
Download and view the complete annual report
Please find page 4 of the 2011 CenturyLink annual report below. You can navigate through the pages in the report by either clicking on the pages listed below, or by using the keyword search tool below to find specific information within the annual report.-
 1
1 -
 2
2 -
 3
3 -
 4
4 -
 5
5 -
 6
6 -
 7
7 -
 8
8 -
 9
9 -
 10
10 -
 11
11 -
 12
12
 |
 |

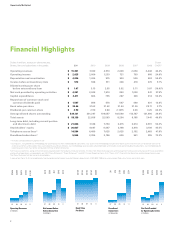
Dollars in millions, except per share amounts. 5-year
Shares, lines and subscribers in thousands. 2011 2010 2009 2008 2007 2006 CAGR(1)
Operating revenues $ 15,351 7,042 4,974 2,600 2,656 2,448 44.4%
Operating income $ 2,025 2,060 1,233 721 793 666 24.9%
Depreciation and amortization $ 4,026 1,434 975 524 536 524 50.4%
Income before extraordinary item $ 573 948 511 366 418 370 9.1%
Diluted earnings per share
before extraordinary item $ 1.07 3.13 2.55 3.52 3.71 3.07 (19.0)%
Net cash provided by operating activities $ 4,201 2,045 1,574 853 1,030 841 37.9%
Capital expenditures $ 2,411 864 755 287 326 314 50.3%
Repurchase of common stock and
common dividends paid $ 1,587 896 576 567 490 831 13.8%
Book value per share $ 33.66 31.62 31.62 31.54 31.36 28.11 3.7%
Dividends per common share $ 2.90 2.90 2.80 2.1675 0.26 0.25 63.3%
Average diluted shares outstanding 534,121 301,297 199,057 102,560 112,787 121,990 34.4%
Total assets $ 56,139 22,038 22,563 8,254 8,185 7,441 49.8%
Long-term debt, including current portion
and short-term debt $ 21,836 7,328 7,754 3,315 3,014 2,591 53.2%
Stockholders’ equity $ 20,827 9,647 9,467 3,168 3,416 3,199 45.5%
Telephone access lines(2) 14,584 6,489 7,025 2,025 2,152 2,083 47.6%
Broadband subscribers(2) 5,554 2,394 2,186 626 541 355 73.3%
(1) Five-year compounded annual growth rate
(2) During 2011, we updated our methodology for counting access lines and broadband subscribers. Our access line methodology includes only those access lines that we use to provide services to
external customers and excludes lines used solely by us and our affiliates. Our methodology also excludes unbundled loops and includes stand-alone broadband subscribers. Our methodology for
counting access lines may not be comparable to those of other companies.
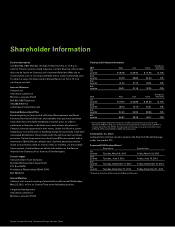
Full financial statements, along with certifications required under the Sarbanes-Oxley Act of 2002, the New York Stock Exchange rules and management’s discussion and analysis of financial condition
and results of operations, are provided in our 2012 Proxy Statement (“Proxy Statement”) and 2011 Annual Report on Form 10-K (“Form 10-K”) filed with the Securities and Exchange Commission.
The Proxy Statement will be mailed to shareholders.
A copy of our Form 10-K can be obtained at no charge by contacting our Investor Relations department at 800.833.1188 or by accessing our Web site at www.centurylink.com.
Financial Highlights
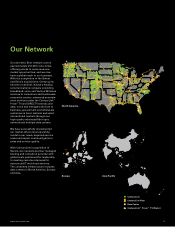
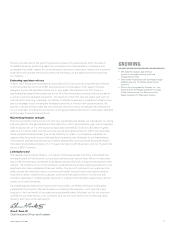
Opportunity Multiplied
2
$31.36
07
$31.54
08
$31.62
09
$31.62
10
$33.66
11
Book Value
Per Share
541
626
2,186
2,394
5,554
Broadband
Subscribers
in thousands
07 08 09 10 11
$1,030
$853
$1,574
$2,045
$4,201
Net Cash Provided
by Operating Activities
in millions
07 08 09 10 11
$418
$366
$51
1
$948
$573
Net Income Before
Extraordinary Item
in millions
07 08 09 10 11
$2,656
$2,600
$4,974
$7,042
$15,351
Operating Revenues
in millions
07 08 09 10 11