CenturyLink 2010 Annual Report Download - page 8
Download and view the complete annual report
Please find page 8 of the 2010 CenturyLink annual report below. You can navigate through the pages in the report by either clicking on the pages listed below, or by using the keyword search tool below to find specific information within the annual report.-
 1
1 -
 2
2 -
 3
3 -
 4
4 -
 5
5 -
 6
6 -
 7
7 -
 8
8 -
 9
9 -
 10
10 -
 11
11 -
 12
12 -
 13
13
 |
 |

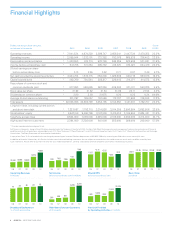
FinancialHighlights
NetIncome
beforeextraordinary item in millions
$370 $418 $366
$511
$948
06 07 08 09 10
Diluted EPS
beforeextraordinary item
Book Value
per share
$3.07 $28.11
$3.71 $31.36
$3.52 $31.54
$2.55
$31.62
$3.13
$31.62
06 0607 0708 0809 0910 10
OperatingRevenues
in millions
$2,448 $2,656$2,600
$4,974
$7,042
06 07 08 09 10
Dollars, exceptper shareamounts,5-year
and shares in thousands 2010 2009 2008 2007 2006 2005 CAGR(1)
Operatingrevenues $7,041,534 4,974,2392,599,747 2,656,2412,447,7302,479,25223.2%
Operatingincome $2,059,9441,233,101 721,352 793,078665,538 736,403 22.8%
Depreciationand amortization $1,433,553 974,710 523,786536,255 523,506 531,931 21.9%
Incomebefore extraordinary item $947,705 511,254 365,732 418,370 370,027 334,479 23.2%
Diluted earningsper share
beforeextraordinary item $3.13 2.55 3.52 3.71 3.07 2.49 4.7%
Netcash provided by operating activities$2,044,704 1,573,715853,300 1,029,986 840,719 967,07816.2%
Capital expenditures $863,769 754,544 286,817 326,045 314,071414,872 15.8%
Repurchase of common stock and
common dividendspaid $877,993 560,685 567,350 489,360 831,011 583,225 8.5%
Book valueper share$31.62 31.62 31.54 31.36 28.11 27.54 2.8%
Dividendsper common share $2.90 2.80 2.16750.26 0.25 0.24 64.6%
Average diluted sharesoutstanding301,297 199,057 102,560 112,787 121,990 136,083 17.2%
Total assets$22,038,098 22,562,729 8,254,1958,184,5537,441,0077,762,70723.2%
Long-termdebt,including currentportion
andshort-term debt$7,327,5877,753,7183,314,5263,014,2552,590,8642,652,80622.5%
Stockholders’equity $9,647,1599,466,799 3,167,808 3,415,8103,198,964 3,624,43121.6%
Telephoneaccess lines6,504,000 7,039,000 2,025,000 2,135,000 2,094,000 2,214,000 24.1%
High-speed Internetcustomers2,394,000 2,236,000 641,000 555,000 369,000 249,000 57.2%
(1) Five-yearcompounded annualgrowth rate
Full financialstatements, along with certifications required under the Sarbanes-Oxley Actof 2002, the NewYork Stock Exchange rules andmanagement’sdiscussion and analysis of financial
condition and results of operations, are provided in our 2011 ProxyStatement (“Proxy Statement”) and2010 AnnualReport on Form10 -K (“Form10-K”) filed with the Securities andExchange
Commission. TheProxyStatement will be mailed to shareholders.
A copy of our Form 10-K can be obtained at no charge by contactingour InvestorRelations department at 800.833.1188or by accessingour Web site at www.centurylink.com.
In addition to historical information, this Reviewincludescertain forward-looking statements that are subject to uncertainties that could cause our actual results to differmaterially from
such statements. Please referto our Form 10-K forthe year ended December 31,2010 fora description of these and other uncertainties related to our business.
High-Speed InternetCustomers
in thousands
369555 641
2,236 2,394
06 07 08 09 10
NetCash Provided
by OperatingActivities in millions
$841$1,030 $853
$1,574
$2,045
06 07 08 09 10
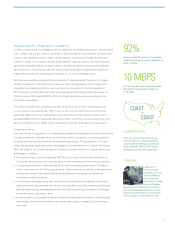
BroadbandDeployment
% of total access lines
79 84 88 89 92
06 07 08 09 10
6 GROW TH +OPPORTUNITY AND SCALE