CenturyLink 2008 Annual Report Download - page 8
Download and view the complete annual report
Please find page 8 of the 2008 CenturyLink annual report below. You can navigate through the pages in the report by either clicking on the pages listed below, or by using the keyword search tool below to find specific information within the annual report.-
 1
1 -
 2
2 -
 3
3 -
 4
4 -
 5
5 -
 6
6 -
 7
7 -
 8
8 -
 9
9 -
 10
10 -
 11
11 -
 12
12
 |
 |

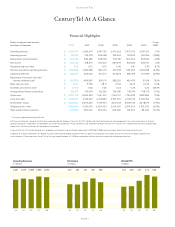
Dollars, except per share amounts, 5-year
and shares in thousands 2008 2007 2006 2005 2004 2003 CAGR(1)
Operating revenues $ 2,599,747 2,656,241 2,447,730 2,479,252 2,407,372 2,367,610 1.9%
Operating income $ 721,352 793,078 665,538 736,403 753,953 750,396 (0.8%)
Depreciation and amortization $ 523,786 536,255 523,506 531,931 500,904 503,652 0.8%
Net income $ 365,732 418,370 370,027 334,479 337,244 344,707 1.2%
Diluted earnings per share $ 3.56 3.72 3.07 2.49 2.41 2.35 8.7%
Net cash provided by operating activities $ 853,300 1,029,986 840,719 967,078 964,050 1,069,068 (4.4%)
Capital expenditures $ 286,817 326,045 314,071 414,872 385,316 377,939 (5.4%)
Repurchase of common stock and
common dividends paid $ 567,350 489,360 831,011 583,225 432,475 31,618 78.1%
Book value per share $ 31.54 31.36 28.11 27.54 25.70 24.04 5.6%
Dividends per common share $ 2.1675 0.26 0.25 0.24 0.23 0.22 58.0%
Average diluted shares outstanding 102,871 113,094 122,229 136,087 142,144 148,779 (7.1%)
Total assets $ 8,254,195 8,184,553 7,441,007 7,762,707 7,796,953 7,895,852 0.9%
Long-term debt $ 3,294,119 2,734,357 2,412,852 2,376,070 2,762,019 3,109,302 1.2%
Stockholders’ equity $ 3,163,240 3,409,205 3,190,951 3,617,273 3,409,765 3,478,516 (1.9%)
Telephone access lines 1,998,000 2,135,000 2,094,000 2,214,000 2,314,000 2,376,000 (3.4%)
High-speed Internet customers 641,000 555,000 369,000 249,000 143,000 83,000 50.5%
(1) Five-year compounded annual growth rate
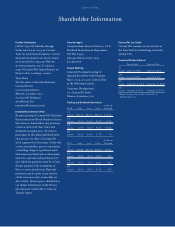
Full financial statements, along with certifications required under the Sarbanes-Oxley Act of 2002, the New York Stock Exchange rules and management’s discussion and analysis of financial
condition and results of operations, are provided in our 2009 Proxy Statement (“Proxy Statement”) and 2008 Annual Report on Form 10-K (“Form 10-K”) filed with the Securities and Exchange
Commission. The Proxy Statement will be mailed to shareholders.
A copy of our Form 10-K can be obtained at no charge by contacting our Investor Relations department at 800.833.1188 or by accessing our Web site at www.centurytel.com.
In addition to historical information, this Review includes certain forward-looking statements that are subject to uncertainties that could cause our actual results to differ materially from
such statements. Please refer to our Form 10-K for the year ended December 31, 2008 for a description of these and other uncertainties related to our business.
Financial Highlights
CenturyTel
04 05 06 07 08
2,407 2,479 2,448 2,656 2,600
Operating Revenues
in millions
05 06 07 0804
2.41 2.49 3.07 3.72 3.56
Diluted EPS
in dollars
05 06 07 0804
337 334 370 418 366
Net Income
in millions
PAGE 6
CenturyTel At A Glance