CenterPoint Energy 2012 Annual Report Download - page 5
Download and view the complete annual report
Please find page 5 of the 2012 CenterPoint Energy annual report below. You can navigate through the pages in the report by either clicking on the pages listed below, or by using the keyword search tool below to find specific information within the annual report.-
 1
1 -
 2
2 -
 3
3 -
 4
4 -
 5
5 -
 6
6 -
 7
7 -
 8
8 -
 9
9 -
 10
10 -
 11
11 -
 12
12 -
 13
13 -
 14
14 -
 15
15 -
 16
16 -
17
-
18
-
19
-
20
-
21
-
22
-
23
-
24
-
25
-
26
-
27
-
28
-
29
-
30
-
31
-
32
-
33
-
34
-
35
-
36
-
37
-
38
-
39
-
40
-
41
-
42
-
43
-
44
-
45
-
46
-
47
-
48
-
49
-
50
-
51
-
52
-
53
-
54
-
55
-
56
-
57
-
58
-
59
-
60
-
61
-
62
-
63
-
64
-
65
-
66
-
67
-
68
-
69
-
70
-
71
-
72
-
73
-
74
-
75
-
76
-
77
-
78
-
79
-
80
-
81
-
82
-
83
-
84
-
85
-
86
-
87
-
88
-
89
-
90
-
91
-
92
-
93
-
94
-
95
-
96
-
97
-
98
-
99
-
100
-
101
-
102
-
103
-
104
-
105
-
106
-
107
-
108
-
109
-
110
-
111
-
112
-
113
-
114
-
115
-
116
-
117
-
118
-
119
-
120
-
121
-
122
-
123
-
124
-
125
-
126
-
127
-
128
-
129
-
130
-
131
-
132
 |
 |
2012 marked another solid year, with each of CenterPoint Energy’s
businesses delivering strong performances.
The year also marked our 10th anniversary as a stand-alone company.
The past decade held many challenges. We experienced the collapse
of credit markets for energy companies. Our service territory took
direct strikes from hurricanes Katrina and Rita in 2005, and again in
2008 from Hurricane Ike. We saw natural gas prices fluctuate between
$15.40 in December 2005 and $2 in April 2012. We navigated through
the Great Recession, which slowed economic activity and energy
consumption. And our electric true-up case, which we hoped could
be resolved in 2004, slowly worked its way through the Texas courts
before it was successfully concluded in 2011. The favorable outcome
allowed us to reduce our debt and restructure our balance sheet.
We overcame these challenges by staying true to the vision, values and
strategy that have defined us. As a result, your company has been one
of the best performing investor-owned utilities over the past 10years.
It’s a remarkable achievement accomplished by remarkable employees.
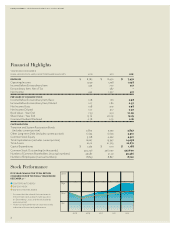
2012 Overview
Led by the performance of our regulated utilities and field services
business, we reported net income of $417 million for 2012. Though at
first glance this number appears to compare unfavorably with our 2011
net income of $1.4 billion, both 2011 and 2012 included some significant,
unusual items. In 2011, our results included net income of $811 million
from our true-up case. Likewise, our 2012 results included two unusual,
non-cash items: a $252 million goodwill impairment charge associated
with our competitive energy services business and a $136 million pre-tax
gain from our purchase of the remaining 50 percent interest in a gathering
and processing joint venture. When you exclude these items, our 2012
net income would have been $581 million, compared with $546million
in 2011.
In January 2012, we raised our quarterly dividend from 19.75 cents per
share to 20.25 cents per share. We raised it again in January 2013 to
20.75 cents per share, making this the eighth consecutive year of
dividend increases. Nevertheless, for utility stock investors 2012 was
anup and down year due to the uncertainty over the economy and
thefuture dividend tax rate. Total shareholder return last year, which
included stock price appreciation and annual dividends, was essentially
flat, with a loss of less than 0.2 percent. This lagged the S&P 500
Utilities Index, which returned 1.3 percent, and the broader market,
asmeasured by the S&P 500 Index, which returned 16.0 percent.
Overall, our shareholder returns have been outstanding. Since 2002,
our cumulative total shareholder return has been 278.1 percent,
compared with 182.1 percent for the S&P 500 Utilities average and
115.2percent for the S&P 500 average.
Business Segment Results
Our electric transmission and distribution business had a great year,
nearly matching its record performance in 2011. Core operating income
was $492 million, compared with $496 million in 2011. The Houston
economy was strong, and we added more than 44,000 customers.
Considering the full-year impact of our 2011 rate case results and the
return of normal weather following record heat, weare very pleased.
Despite a mild heating season and reduced gas use, our natural
gasdistribution business matched its excellent 2011 results. Core
operating income for the year was $226 million, identical to last year’s
total. We added more than 22,000 customers, primarily inHouston
and Minneapolis. Our rate design strategy remains focused on ensuring
timely cost recovery to give us an opportunity to earn at or near our
authorized rates of return.
Dear
Shareholder,
The Value of Vision
3