CenterPoint Energy 2012 Annual Report Download - page 4
Download and view the complete annual report
Please find page 4 of the 2012 CenterPoint Energy annual report below. You can navigate through the pages in the report by either clicking on the pages listed below, or by using the keyword search tool below to find specific information within the annual report.-
 1
1 -
 2
2 -
 3
3 -
 4
4 -
 5
5 -
 6
6 -
 7
7 -
 8
8 -
 9
9 -
 10
10 -
 11
11 -
 12
12 -
 13
13 -
 14
14 -
 15
15 -
16
-
17
-
18
-
19
-
20
-
21
-
22
-
23
-
24
-
25
-
26
-
27
-
28
-
29
-
30
-
31
-
32
-
33
-
34
-
35
-
36
-
37
-
38
-
39
-
40
-
41
-
42
-
43
-
44
-
45
-
46
-
47
-
48
-
49
-
50
-
51
-
52
-
53
-
54
-
55
-
56
-
57
-
58
-
59
-
60
-
61
-
62
-
63
-
64
-
65
-
66
-
67
-
68
-
69
-
70
-
71
-
72
-
73
-
74
-
75
-
76
-
77
-
78
-
79
-
80
-
81
-
82
-
83
-
84
-
85
-
86
-
87
-
88
-
89
-
90
-
91
-
92
-
93
-
94
-
95
-
96
-
97
-
98
-
99
-
100
-
101
-
102
-
103
-
104
-
105
-
106
-
107
-
108
-
109
-
110
-
111
-
112
-
113
-
114
-
115
-
116
-
117
-
118
-
119
-
120
-
121
-
122
-
123
-
124
-
125
-
126
-
127
-
128
-
129
-
130
-
131
-
132
 |
 |

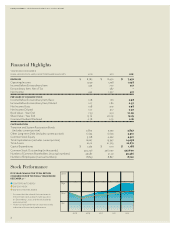
Financial Highlights
YEAR ENDED DECEMBER
IN MILLIONS OF DOLLARS, EXCEPT PER SHARE AMOUNTS
REVENUES $ 8,785 $ 8,450 $ 7,452
Operating Income 1,249 1,298 1,038
Income Before Extraordinary Item 442 770 417
Extraordinary Item, Net of Tax – 587 –
Net Income 442 1,357 417
PER SHARE OF COMMON STOCK
Income Before Extraordinary Item, Basic 1.08 1.81 0.98
Income Before Extraordinary Item, Diluted 1.07 1.80 0.97
Net Income, Basic 1.08 3.19 0.98
Net Income, Diluted 1.07 3.17 0.97
Book Value – Year End 7.53 9.91 10.09
Share Value – Year End 15.72 20.09 19.25
Common Dividend Declared 0.78 0.79 0.81
CAPITALIZATION
Transition and System Restoration Bonds
(includes current portion) 2,805 2,522 3,847
Other Long-term Debt (includes current portion) 6,624 6,603 5,910
Common Stock Equity 3,198 4,222 4,301
Total Capitalization (includes current portion) 12,627 13,347 14,058
Total Assets 20,111 21,703 22,871
Capital Expenditures $ 1,462 $ 1,191 $ 1,188
Common Stock Outstanding (in thousands) 424,746 426,030 427,600
Number of Common Shareholders (in actual numbers) 43,587 41,141 39,366
Number of Employees (in actual numbers) 8,843 8,827 8,720
Stock Performance
$50
2008
$100
$150
$200
2009 2010 2011 2012
FIVE-YEAR CUMULATIVE TOTAL RETURN
COMPARISON FOR THE FISCAL YEARS ENDED
DECEMBER 31(1) (2)
● CENTERPOINT ENERGY
● S&P INDEX
● S&P UTILITIES INDEX
(1) Assumes that the value of the investment in
thecommon stock and each index was $100
onDecember 31, 2007, and that all dividends
werereinvested.
(2) Historical stock performance is not necessarily
indicative of future stock performance.
VALUE from VISION // CENTERPOINT ENERGY 2012 ANNUAL REPORT
2