CenterPoint Energy 2010 Annual Report Download - page 15
Download and view the complete annual report
Please find page 15 of the 2010 CenterPoint Energy annual report below. You can navigate through the pages in the report by either clicking on the pages listed below, or by using the keyword search tool below to find specific information within the annual report.-
 1
1 -
2
-
3
-
4
-
 5
5 -
 6
6 -
 7
7 -
 8
8 -
 9
9 -
 10
10 -
 11
11 -
 12
12 -
 13
13 -
 14
14 -
 15
15 -
 16
16 -
 17
17 -
 18
18 -
 19
19 -
 20
20 -
 21
21 -
 22
22 -
 23
23 -
 24
24 -
 25
25 -
26
-
27
-
28
-
29
-
30
-
31
-
32
-
33
-
34
-
35
-
36
-
37
-
38
-
39
-
40
-
41
-
42
-
43
-
44
-
45
-
46
-
47
-
48
-
49
-
50
-
51
-
52
-
53
-
54
-
55
-
56
-
57
-
58
-
59
-
60
-
61
-
62
-
63
-
64
-
65
-
66
-
67
-
68
-
69
-
70
-
71
-
72
-
73
-
74
-
75
-
76
-
77
-
78
-
79
-
80
-
81
-
82
-
83
-
84
-
85
-
86
-
87
-
88
-
89
-
90
-
91
-
92
-
93
-
94
-
95
-
96
-
97
-
98
-
99
-
100
-
101
-
102
-
103
-
104
-
105
-
106
-
107
-
108
-
109
-
110
-
111
-
112
-
113
-
114
-
115
-
116
-
117
-
118
-
119
-
120
-
121
-
122
-
123
-
124
-
125
-
126
-
127
-
128
-
129
-
130
-
131
-
132
-
133
-
134
-
135
-
136
-
137
-
138
-
139
-
140
-
141
-
142
-
143
-
144
-
145
-
146
-
147
-
148
-
149
-
150
-
151
-
152
 |
 |

With significant expansions under
long-term contracts and a resumption
of drilling activity, especially in the shale
areas, field services had an excellent
year. Total system throughput increased
49 percent to 2.0 billion cubic feet (Bcf)
per day by year-end. Our gathering
volumes reached record levels, a
53 percent increase to 650 Bcf for
the year.
Operating income was $151 million in
2010 plus $10 million in equity income
from a natural gas gathering and
processing joint venture. This compares
to $94 million plus $8 million in equity
income the previous year.
We continued our long-term strategy of
making intelligent investments in this
midstream business. Last year, we invested
more than $650 million, our highest level
ever, and placed substantial new facilities
in service – ahead of schedule and under
budget. Our contracting focus has been to
obtain acreage dedications and minimum
volume commitments that provide steady
fee-based revenue and significant growth
potential, insulating us from production
volume fluctuations.
Through agreements with subsidiaries of
Encana and Shell, we are expanding our
systems to gather and treat up to 1.5 Bcf per
day in the Haynesville Shale. These projects
include our interconnected Magnolia and
Olympia systems. We are now the largest
non-producer gatherer in the Haynesville
Shale in terms of system capacity.
We invested $310 million to build our
Magnolia system’s initial capacity of
700 million cubic feet (MMcf) per day.
By the end of the first quarter of 2011, we
will have spent approximately $52 million
to provide another 200 MMcf per day,
raising system capacity to 900 MMcf per
Expanding our Investments and Facilities Through
Long-Term Agreements to Meet Growing Energy Needs
FIELD SERVICES
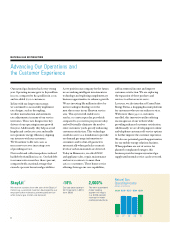
We reduced
recordable safety
incidents by
50 percent,
while increasing
construction hours
by 25 percent.
In 2010, we constructed nearly 380 miles of
gathering lines, more than 45,000 horsepower
of compression and treating capacity of more
than 5,100 gallons per minute in the Haynesville,
Fayetteville and Woodford shale areas.
Last year, we invested more than
$650 million, our highest level ever,
and placed substantial new facilities
in service – ahead of schedule and
under budget.
50%380 MILES $650 MILLION+
We continue to see opportunities
in the Haynesville, Woodford
and Fayetteville shales as well
as outside our footprint.
n Field Service Areas
n Shales
13
day. Should Encana and Shell increase
production, we could invest as much as
$240 million to add capacity of up to
800 MMcf per day, bringing total capacity
to 1.7 Bcf per day.
In our Olympia system, we invested
$340 million in 2010 and will invest
$85 million in 2011 to bring 600 MMcf
of capacity per day into service. If Encana
or Shell elects to provide additional
volume commitments, we could invest
an estimated $200 million to gather and
treat up to an additional 520 MMcf per day,
bringing total capacity to 1.1 Bcf per day.
With a 25 percent increase in construction
hours, we realized a 50 percent reduction
in our workforce safety incidents last year.
We continue to pursue growth projects
that meet our investment criteria in the
Haynesville, Woodford and Fayetteville
shales and non-contiguous areas, such as
the Eagle Ford and Marcellus shales.
06 07 08 09 10
375 398 421 426 650
Field Services:
Annual Throughput
billion cubic feet