CenterPoint Energy 2008 Annual Report Download - page 5
Download and view the complete annual report
Please find page 5 of the 2008 CenterPoint Energy annual report below. You can navigate through the pages in the report by either clicking on the pages listed below, or by using the keyword search tool below to find specific information within the annual report.-
 1
1 -
 2
2 -
 3
3 -
 4
4 -
 5
5 -
 6
6 -
 7
7 -
 8
8 -
 9
9 -
 10
10 -
 11
11 -
 12
12 -
 13
13 -
 14
14 -
 15
15 -
 16
16 -
17
-
18
-
19
-
20
-
21
-
22
-
23
-
24
-
25
-
26
-
27
-
28
-
29
-
30
-
31
-
32
-
33
-
34
-
35
-
36
-
37
-
38
-
39
-
40
-
41
-
42
-
43
-
44
-
45
-
46
-
47
-
48
-
49
-
50
-
51
-
52
-
53
-
54
-
55
-
56
-
57
-
58
-
59
-
60
-
61
-
62
-
63
-
64
-
65
-
66
-
67
-
68
-
69
-
70
-
71
-
72
-
73
-
74
-
75
-
76
-
77
-
78
-
79
-
80
-
81
-
82
-
83
-
84
-
85
-
86
-
87
-
88
-
89
-
90
-
91
-
92
-
93
-
94
-
95
-
96
-
97
-
98
-
99
-
100
-
101
-
102
-
103
-
104
-
105
-
106
-
107
-
108
-
109
-
110
-
111
-
112
-
113
-
114
-
115
-
116
-
117
-
118
-
119
-
120
-
121
-
122
-
123
-
124
-
125
-
126
-
127
-
128
-
129
-
130
-
131
-
132
-
133
-
134
-
135
-
136
-
137
-
138
-
139
-
140
 |
 |

PA
NY
VT NH
MA
CT
RI
ME
NJ
DE
MD
VA
WV
OH
KY
GA
FL
SC
NC
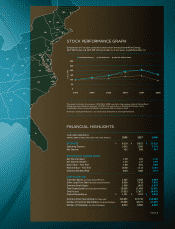
STOCK PERFORMANCE GRAPH
Comparison of five-year cumulative total return among CenterPoint Energy,
S&P 500 Index and S&P 500 Utilities Index for fiscal years ended December 31
The graph illustrates the value on 12/31/08 of $100 invested in the common stock of CenterPoint
Energy and each reference group on 12/31/03. The calculation of CenterPoint Energy’s total
shareholder return assumes dividends were reinvested in company stock.
Historical stock performance is not necessarily indicative of future performance.
FINANCIAL HIGHLIGHTS
YEAR ENDED DECEMBER 31
IN MILLIONS OF DOLLARS (EXCEPT PER SHARE AMOUNTS) 2006 2007 2008
REVENUES $ 9,319 $ 9,623 $ 11,322
Operating Income 1,045 1,185 1,273
Net Income 432 399 447
PER SHARE OF COMMON STOCK
Net Income, Basic 1.39 1.25 1.33
Net Income, Diluted 1.33 1.17 1.30
Book Value – Year End 4.96 5.61 5.89
Market Value – Year End 16.58 17.13 12.62
Common Dividend Paid 0.60 0.68 0.73
CAPITALIZATION
Transition Bonds (Includes Current Portion) 2,407 2,260 2,589
Other Long-Term Debt (Includes Current Portion) 6,593 7,419 7,925
Common Stock Equity 1,556 1,810 2,037
Total Capitalization (Includes Current Portion) 10,556 11,489 12,551
Total Assets 17,633 17,872 19,676
Capital Expenditures $ 1,121 $ 1,011 $ 1,053
Common Stock Outstanding (In Thousands) 313,652 322,719 346,089
Number of Common Shareholders (In Actual Numbers) 52,085 49,271 47,405
Number of Employees (In Actual Numbers) 8,623 8,568 8,801
PAGE 3
0
50
100
150
200
250
300
2003 2004 2005 2006 2007 2008
CenterPoint Energy S&P 500 Index S&P 500 Utilities Index
DOLLARS