CenterPoint Energy 2008 Annual Report Download - page 3
Download and view the complete annual report
Please find page 3 of the 2008 CenterPoint Energy annual report below. You can navigate through the pages in the report by either clicking on the pages listed below, or by using the keyword search tool below to find specific information within the annual report.-
 1
1 -
 2
2 -
 3
3 -
 4
4 -
 5
5 -
 6
6 -
 7
7 -
 8
8 -
 9
9 -
 10
10 -
 11
11 -
 12
12 -
 13
13 -
 14
14 -
15
-
16
-
17
-
18
-
19
-
20
-
21
-
22
-
23
-
24
-
25
-
26
-
27
-
28
-
29
-
30
-
31
-
32
-
33
-
34
-
35
-
36
-
37
-
38
-
39
-
40
-
41
-
42
-
43
-
44
-
45
-
46
-
47
-
48
-
49
-
50
-
51
-
52
-
53
-
54
-
55
-
56
-
57
-
58
-
59
-
60
-
61
-
62
-
63
-
64
-
65
-
66
-
67
-
68
-
69
-
70
-
71
-
72
-
73
-
74
-
75
-
76
-
77
-
78
-
79
-
80
-
81
-
82
-
83
-
84
-
85
-
86
-
87
-
88
-
89
-
90
-
91
-
92
-
93
-
94
-
95
-
96
-
97
-
98
-
99
-
100
-
101
-
102
-
103
-
104
-
105
-
106
-
107
-
108
-
109
-
110
-
111
-
112
-
113
-
114
-
115
-
116
-
117
-
118
-
119
-
120
-
121
-
122
-
123
-
124
-
125
-
126
-
127
-
128
-
129
-
130
-
131
-
132
-
133
-
134
-
135
-
136
-
137
-
138
-
139
-
140
 |
 |

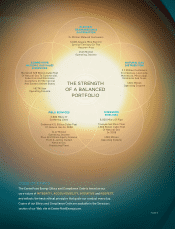
CODE OF ETHICS
The CenterPoint Energy Ethics and Compliance Code is based on our
core values of INTEGRITY, ACCOUNTABILITY, INITIATIVE and RESPECT,
and reflects the basic ethical principles that guide our conduct every day.
Copies of our Ethics and Compliance Code are available in the Investors
section of our Web site at CenterPointEnergy.com.
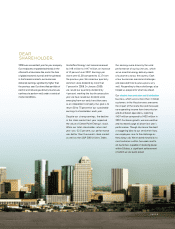
THE STRENGTH
OF A BALANCED
PORTFOLIO
ElEctric
transmission &
Distribution
2+ Million Metered Customers
5,000-Square-Mile Electric
Service Territory In The
Houston Area
$545 Million
Operating Income
natural Gas
Distribution
3.2 Million Customers
In Arkansas, Louisiana,
Minnesota, Mississippi,
Oklahoma And Texas
$215 Million
Operating Income
compEtitivE
natural Gas salEs
& sErvicEs
Marketed 528 Billion Cubic Feet
Of Natural Gas To Commercial,
Industrial And Wholesale
Customers In The Central
And Eastern United States
$62 Million
Operating Income
FiElD sErvicEs
3,600 Miles Of
Gathering Lines
Gathered 421 Billion Cubic Feet
Of Natural Gas In 2008
$147 Million
Operating Income
Plus $15 Million Equity Income
From A Jointly Owned
Natural Gas
Processing Plant
intErstatE
pipElinEs
8,000 Miles Of Pipe
Transported More Than
1,500 Billion Cubic Feet
Of Natural Gas
In 2008
$293 Million
Operating Income
PAGE 1