Casio 2002 Annual Report Download - page 3
Download and view the complete annual report
Please find page 3 of the 2002 Casio annual report below. You can navigate through the pages in the report by either clicking on the pages listed below, or by using the keyword search tool below to find specific information within the annual report.-
 1
1 -
 2
2 -
 3
3 -
 4
4 -
 5
5 -
 6
6 -
 7
7 -
 8
8 -
 9
9 -
 10
10 -
 11
11 -
 12
12 -
 13
13 -
 14
14 -
15
-
16
-
17
-
18
-
19
-
20
-
21
-
22
-
23
-
24
-
25
-
26
-
27
-
28
-
29
-
30
-
31
-
32
-
33
-
34
-
35
-
36
 |
 |

Performance
The fiscal year ended March 31, 2002, saw Casio’s
operating environment change rapidly, sparked by
worse-than-predicted economic doldrums, which in
turn paralyzed consumer demand. As a result, con-
solidated net sales fell 13.9%, to ¥382,154 million.
These conditions resulted in a divergence from our
original projections, with operating loss logging
in at ¥10,418 million. Moreover, after calculating
such strategic restructuring charges as the disposal
and devaluation of inventories and investment
securities and structural reform charges, net loss
for the period was ¥24,928 million. The operating
loss was mainly a result of steep drops in the prices
of digital cameras and consumer PDAs brought
about by intensified global competition. In addition,
sluggish demand worldwide for cellular phones, PCs,
and other IT-related items led to decreased sales
and income in our electronic components category.
One of our fundamental policies, however, is
to maintain stable dividends, and we continued
to pay a ¥12.50 dividend per share for the year.
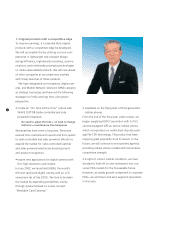
Return to Profitable Growth
We aim to return to profitable growth by reem-
phasizing our management creed, “To use ingen-
ious concepts and state-of-the-art technology
to create products and services that will delight
people throughout the world;” developing
original products with a competitive edge;
and cutting costs.
1
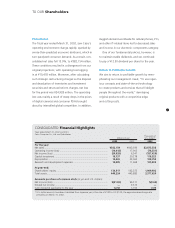
TO OUR Shareholders
CONSOLIDATED Financial Highlights
Thousands of
Millions of yen U.S. dollars*
2002 2001 2002
For the year:
Net sales.............................................................................................. ¥382,154 ¥443,930 $2,873,338
Operating income (loss) ....................................................................... (10,418) 17,905 (78,331)
Net income (loss) ................................................................................. (24,928) 6,547 (187,429)
Capital investment............................................................................... 15,737 30,278 118,323
Depreciation ........................................................................................ 14,465 22,065 108,759
Research and development expenses ................................................... 14,085 11,968 105,902
At year-end:
Shareholders’ equity ............................................................................ 134,317 162,375 1,009,902
Total assets.......................................................................................... 449,224 445,883 3,377,624
Amounts per share of common stock (in yen and U.S. dollars):
Net income (loss) ................................................................................. ¥(91.82) ¥24.11 $(0.69)
Diluted net income .............................................................................. —23.72 —
Cash dividends applicable to the year .................................................. 12.50 12.50 0.09
* U.S. dollar amounts have been translated from Japanese yen at the rate of ¥133 to U.S.$1.00, the approximate exchange rate
prevailing on March 31, 2002.
Years ended March 31, 2002 and 2001
Casio Computer Co., Ltd. and Subsidiaries