Cash America 2003 Annual Report Download - page 5
Download and view the complete annual report
Please find page 5 of the 2003 Cash America annual report below. You can navigate through the pages in the report by either clicking on the pages listed below, or by using the keyword search tool below to find specific information within the annual report.-
 1
1 -
 2
2 -
 3
3 -
 4
4 -
 5
5 -
 6
6 -
 7
7 -
 8
8 -
 9
9 -
 10
10 -
 11
11 -
 12
12 -
 13
13 -
 14
14 -
 15
15 -
 16
16 -
17
-
18
-
19
 |
 |

CASH AM ERICA IN TERN ATIO N AL, IN C.
3
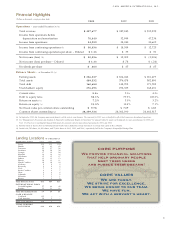
(Dollars in thousands, except per share data) 2003 2002 2001
Operations – years ended December 31 (a)
Total revenue $ 437,677 $ 387,843 $ 355,929
Income from operations before
depreciation and amortization 70,440 52,999 47,234
Income from operations 54,299 38,040 30,605
Income from continuing operations (b) $ 30,036 $ 18,509 $ 12,725
Income from continuing operations per share – Diluted $ 1.13 $ .75 $ .51
Net income (loss) (b) $ 30,036 $ 19,309 $ (5,906)
Net income (loss) per share – Diluted $1.13 $ .78 $ (.24)
Dividends per share $ .065 $ .05 $ .05
Balance Sheets – at December 31 (a)
Earning assets $ 226,337 $ 184,042 $ 181,677
Total assets 489,532 376,478 382,890
Total debt 160,680 148,702 171,782
Stockholders’ equity 276,493 192,335 168,431
Current ratio 5.4x 5.1x 4.5x
Debt to equity ratio 58.1% 77.3% 102.0%
Return on assets (c) 7.2% 5.0% 3.2%
Return on equity (c) 13.5% 10.4% 7.1%
Net book value per common share outstanding $ 9.78 $ 7.89 $ 6.83
Common shares outstanding (d) 28,259,726 24,362,190 24,662,315
(a) In September 2001, the Company announced plans to exit the rent-to-own business. The amounts for 2001 were reclassified to reflect this business as discontinued operations.
(b) See “Management’s Discussion and Analysis of Financial Condition and Results of Operations” for amount related to a gain on the disposal of a non-operating asset in 2003 and
Note 17 of Notes to Consolidated Financial Statements for amounts related to discontinued operations for 2001 and 2002.
(c) Returns based on Income from Continuing Operations after taxes divided by average total assets or average total equity of the Company.
(d) Includes 64,742 shares, 66,820 shares, and 70,469 shares in 2003, 2002, and 2001, respectively, held in the Company’s Nonqualified Savings Plan.
Financial Highlights
Lending Locations As of December 31
DOMESTIC PAWN 2003 2002 2001
Texas 173 171 174
Florida 63 62 62
Tennessee 25 27 28
Louisiana 20 20 20
Georgia 17 19 20
Missouri 16 16 16
Oklahoma 15 15 17
Indiana 13 13 13
Illinois 10 12 11
North Carolina 10 10 10
Alabama 9 9 9
Kentucky 9 9 9
Utah 7 6 7
South Carolina 6 6 7
Ohio 6 6 6
Colorado 5 5 5
Nebraska 1 1 1
Kansas – 2 2
Total Domestic Pawn 405 409 417
INTERNATIONAL PAWN
United Kingdom 57 48 45
Sweden 12 11 11
Total International Pawn 69 59 56
CASH ADVANCE
Cashland 135 – –
Cash America 19 2 –
Total Cash Advance 154 2 –
TOTAL LENDING
LOCATIONS 628 470 473