Carphone Warehouse 2008 Annual Report Download - page 5
Download and view the complete annual report
Please find page 5 of the 2008 Carphone Warehouse annual report below. You can navigate through the pages in the report by either clicking on the pages listed below, or by using the keyword search tool below to find specific information within the annual report.
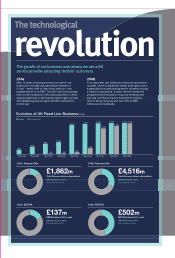
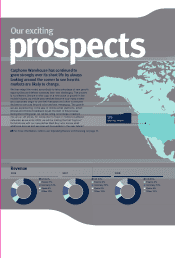
2004: Revenue Mix 2008: Revenue Mix
The growth of our business now means we are a full
service provider attracting ‘mobile’ customers.
2004
After 15 years of rapid growth and innovation, the
Distribution business was generating revenues of
£1.6bn – nearly 90% of total Group revenue – and
substantially all of its EBIT. The UK Fixed Line business,
built on the foundations of the Opal acquisition in 2002,
was just beginning to demonstrate rapid organic growth,
with TalkTalk signing up nearly 400,000 customers in
its first year.
2008
Four years later, and Distribution revenues have almost
doubled, driven by significant market share gains and a
substantial store opening programme. However, through
a series of acquisitions, a major network investment
programme and the launch of ground-breaking new
services, UK Fixed Line now accounts for nearly a
third of Group revenues and over 40% of EBIT
before central overheads.
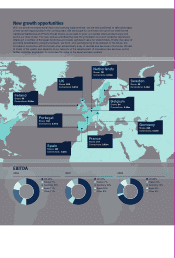
2004: EBITDA 2008: EBITDA
Voice Broadband
revolution
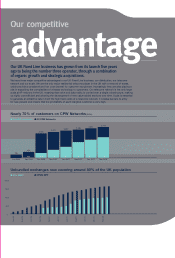
Mar 2004 Sep 2004 Mar 2005 Sep 2005 Mar 2006 Sep 2006 Mar 2007 Sep 2007 Mar 2008
1,059
168
528
2,271
2,486
2,713
385
648
50
920
68
2,570 2,657 2,725 2,739 2,741
£1,862m
Total Revenue before eliminations
UK Fixed Line: 13%
Distribution: 87%
£4,516m
Total Revenue before eliminations
UK Fixed Line: 31%
Distribution: 69%
£137m
EBITDA before PLC costs
UK Fixed Line: 18%
Distribution: 82%
£502m
EBITDA before PLC costs
UK Fixed Line: 45%
Distribution: 55%
Evolution of UK Fixed Line Business (000s)

