Carphone Warehouse 2003 Annual Report Download - page 21
Download and view the complete annual report
Please find page 21 of the 2003 Carphone Warehouse annual report below. You can navigate through the pages in the report by either clicking on the pages listed below, or by using the keyword search tool below to find specific information within the annual report.-
 1
1 -
2
-
3
-
4
-
5
-
6
-
7
-
8
-
9
-
10
-
 11
11 -
 12
12 -
 13
13 -
 14
14 -
 15
15 -
 16
16 -
 17
17 -
 18
18 -
 19
19 -
 20
20 -
 21
21 -
 22
22 -
 23
23 -
 24
24 -
 25
25 -
 26
26 -
 27
27 -
 28
28 -
 29
29 -
 30
30 -
 31
31 -
32
-
33
-
34
-
35
-
36
-
37
-
38
-
39
-
40
-
41
-
42
-
43
-
44
 |
 |

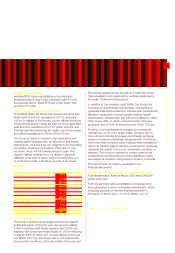
Performance graph
The following graph shows the Group’s performance measured by TSR, compared with the performance of the FTSE 250 Index also measured by
TSR since flotation in July 2000 to 29 March 2003. A three month rolling average has been applied.
The FTSE 250 was selected as it is a broad market index of which the Group is a member. In addition, the Group uses that group of companies
amongst others for comparison of pay and benefit levels.
The following chart shows the Company’s performance measured by TSR compared with a sector comparator group comprising a group of UK
general retailers and European telecoms companies for the period 3 June 2002 to 29 March 2003. A three month rolling average has been applied.
This report was approved by the Board on 29 May 2003.
J Gildersleeve
29 May 2003
20
40
60
80
100
120
140
TSR (rebased to 100 at 3 June 2002)
Carphone Warehouse
UQ
Median
LQ
03/06/02 p/e 29/03/03
14/07/00
20
40
60
80
100
120
TSR (rebased to 100 at 14 July 2000)
FTSE 250 Index
Carphone Warehouse
p/e 31/03/0114/07/00 p/e 30/03/02 p/e 29/03/03
19
The Carphone Warehouse Group PLC Annual Report 2003