Carnival Cruises 2004 Annual Report Download - page 13
Download and view the complete annual report
Please find page 13 of the 2004 Carnival Cruises annual report below. You can navigate through the pages in the report by either clicking on the pages listed below, or by using the keyword search tool below to find specific information within the annual report.-
 1
1 -
2
-
 3
3 -
 4
4 -
 5
5 -
 6
6 -
 7
7 -
 8
8 -
 9
9 -
 10
10 -
 11
11 -
 12
12 -
 13
13 -
 14
14 -
 15
15 -
 16
16 -
 17
17 -
 18
18 -
 19
19 -
 20
20 -
 21
21 -
 22
22 -
 23
23 -
24
-
25
-
26
-
27
-
28
-
29
-
30
-
31
-
32
-
33
-
34
-
35
-
36
-
37
-
38
-
39
-
40
-
41
-
42
-
43
-
44
-
45
-
46
-
47
-
48
-
49
-
50
-
51
-
52
-
53
 |
 |

Notes to Consolidated Financial Statements (continued)
Cash and Cash Equivalents and Short-Term
Investments
Cash and cash equivalents include investments with
original maturities of three months or less, which are
stated at cost. At November 30, 2004 and 2003, cash
and cash equivalents included $495 million and $477
million of investments, respectively, primarily comprised
of investment grade asset-backed debt obligations,
commercial paper and money market funds.
Substantially all our short-term investments are com-
prised of investment grade variable rate debt obligations,
which are asset-backed and categorized as available-for-
sale. Accordingly, our investments in these securities
are recorded at cost, which approximates fair value due
to their variable interest rates, which typically reset
every 28 days. Despite the long-term nature of their
stated contractual maturities, we have the ability to
quickly liquidate these securities. As a result of the
resetting variable rates, we had no cumulative gross
unrealized or realized holding gains or losses from these
investments. All income generated from these invest-
ments was recorded as interest income.
Inventories
Inventories consist primarily of provisions, gift shop
and art merchandise held for resale, fuel and supplies
carried at the lower of cost or market. Cost is deter-
mined using the weighted-average or first-in, first-out
methods.
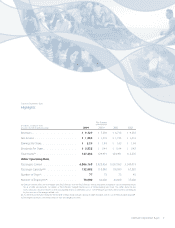
Property and Equipment
Property and equipment are stated at cost. Deprecia-
tion and amortization were computed using the straight-
line method over our estimates of average useful lives
and residual values, as a percentage of original cost,
as follows:
Residual
Values Years
Ships. . . . . . . . . . . . . . . . . . . . 15% 30
Ship improvements. . . . . . . . . 0% or 15% 2 to remaining
life of ship
Buildings and
improvements . . . . . . . . . . . 0–10% 5–40
Transportation equipment
and other. . . . . . . . . . . . . . . 0–25% 2–20
Leasehold improvements,
including port facilities. . . . . Shorter of
lease term
or related
asset life
We review our long-lived assets for impairment when-
ever events or changes in circumstances indicate that
the carrying amount of these assets may not be fully
recoverable. The assessment of possible impairment is
based on our ability to recover the carrying value of our
asset based on our estimate of its undiscounted future
cash flows. If these estimated undiscounted future cash
flows are less than the carrying value of the asset, an
impairment charge is recognized for the excess, if any,
of the asset’s carrying value over its estimated fair value.
See Note 4.
Dry-dock costs primarily represent planned major
maintenance activities that are incurred when a ship is
taken out of service for scheduled maintenance. These
costs are included in prepaid expenses and are amortized
to other ship operating expenses using the straight-line
method generally over one year.
Ship improvement costs that we believe add value
to our ships are capitalized to the ships, and depreci-
ated over the improvements’ estimated useful lives,
while costs of repairs and maintenance are charged to
expense as incurred. Upon replacement or refurbish-
ment of previously capitalized ship components, these
assets’ estimated cost and accumulated depreciation
are written off.
We capitalize interest on ships and other capital proj-
ects during their construction period.
Goodwill
We review our goodwill for impairment annually, or,
when events or circumstances dictate, more frequently.
All of our goodwill has been allocated to our cruise
reporting units. In April 2003, we recorded $2.25 billion
of goodwill as a result of our acquisition of Carnival plc
(see Note 3). There were no other significant changes
to our goodwill carrying amounts since November 30,
2002, other than the changes resulting from using dif-
ferent foreign currency translation rates at each balance
sheet date, except as noted below.
During 2004, we increased the fair values of the P&O
Princess publicly traded debt, and correspondingly,
goodwill, by $61 million to take into account the exten-
sion of Carnival Corporation’s guarantee to cover this
debt as of the acquisition date. In addition, we reduced
the fair value of P&O Princess’ trademarks and, corre-
spondingly increased goodwill by $54 million to properly
value our acquired trademarks as of the acquisition date.
The impact of these changes on our current and prior
period financial statements was immaterial.
Our goodwill impairment reviews consist of a two-
step process of first determining the fair value of the
reporting unit and comparing it to the carrying value of
the net assets allocated to the reporting unit. Fair values
of our reporting units were determined based on our
estimates of comparable market price or discounted
future cash flows. If this fair value exceeds the carrying
value, which was the case for our reporting units, no
10 Carnival Corporation & plc