CDW 2003 Annual Report Download - page 11
Download and view the complete annual report
Please find page 11 of the 2003 CDW annual report below. You can navigate through the pages in the report by either clicking on the pages listed below, or by using the keyword search tool below to find specific information within the annual report.-
 1
1 -
 2
2 -
 3
3 -
 4
4 -
 5
5 -
 6
6 -
 7
7 -
 8
8 -
 9
9 -
 10
10 -
 11
11 -
 12
12 -
 13
13 -
 14
14 -
 15
15 -
 16
16 -
 17
17 -
 18
18 -
 19
19 -
 20
20 -
 21
21 -
 22
22 -
23
-
24
-
25
-
26
-
27
-
28
-
29
-
30
-
31
-
32
-
33
-
34
-
35
-
36
-
37
-
38
-
39
-
40
-
41
-
42
-
43
-
44
-
45
-
46
-
47
-
48
-
49
-
50
-
51
-
52
-
53
-
54
-
55
-
56
-
57
-
58
-
59
-
60
-
61
-
62
-
63
-
64
-
65
-
66
-
67
-
68
-
69
-
70
-
71
-
72
-
73
-
74
-
75
-
76
-
77
-
78
-
79
-
80
-
81
 |
 |

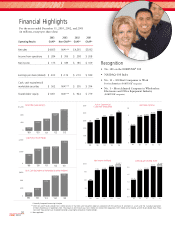
Financial Highlights
For the years ended December 31, 2003, 2002, and 2001
(in millions, except per share data)
Recognition
• No. 381 on the FORTUNE®500
• NASDAQ-100 Index
• No. 11 – 100 Best Companies to Work
for in America (FORTUNE®magazine)
• No. 1 – Most Admired Company in Wholesalers:
Electronics and Office Equipment Industry
(FORTUNE®magazine)
Active Commercial
Customers (thousands) Net Sales (billions)
Net Income (millions)
'99
0
100
200
300
400
500
'03'02'01'00
309
357 361
416
285
'03'02'01'00
0
1
2
3
4
$5
‘99
$3.842 $3.962
$4.265
$4.665
$2.561
$1,057
$829
$416
$615
'03
'02
'01
'00
Direct Web Sales (millions)
'99
$163
0
$1,200
800
400
Earnings per Diluted Share
'99 '03'02'01'00
0.0
0.5
1.0
1.5
2.0
$1.79 $1.89
$2.10 $2.03
$2.19**
$1.11
*Generally Accepted Accounting Principles
**2003 non-GAAP results exclude $22.3 million pre-tax of transition and transaction expenses associated with the purchase of selected U.S. assets and the Canadian operations
of Micro Warehouse in September 2003. The impact on 2003 results was $22.0 million on income from operations, $13.5 million on net income, and $0.16 per diluted share. These
non-GAAP measurements are included to provide a meaningful comparison to prior periods.
***Non-applicable
2003 2003 2002 2001
Operating Results GAAP* Non-GAAP** GAAP* GAAP*
Net sales $4,665 N/A*** $ 4,265 $3,962
Income from operations $ 284 $ 306 $ 298 $ 268
Net income $ 175 $ 189 $ 185 $ 169
Earnings per share (diluted) $ 2.03 $ 2.19 $ 2.10 $ 1.89
Cash, cash equivalents &
marketable securities $ 562 N/A*** $ 505 $ 394
Shareholders’ equity $1,061 N/A*** $ 924 $ 779
$562
$505
$203
$394
'03
'02
'01
'00
Cash,
Cash
Equivalents
&
Marketable
Securities
(millions)
'99
$83
$600
400
0
200
1,924
1,320
1,216
1,301
'03
'02
'01
'00
Sales Force, End-of-Period
'99
798
2,000
0
1,000
20
CDW 2003
'03'02'01'00
0
50
100
150
$200
$162 $169
$185 $175
$189**
$98
'99