Bridgestone 2013 Annual Report Download - page 3
Download and view the complete annual report
Please find page 3 of the 2013 Bridgestone annual report below. You can navigate through the pages in the report by either clicking on the pages listed below, or by using the keyword search tool below to find specific information within the annual report.-
 1
1 -
 2
2 -
 3
3 -
 4
4 -
 5
5 -
 6
6 -
 7
7 -
 8
8 -
 9
9 -
 10
10 -
 11
11 -
 12
12 -
 13
13 -
 14
14 -
15
-
16
-
17
-
18
 |
 |

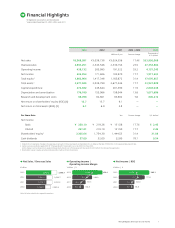
1Annual Report 2013 Operational Review
Financial Highlights
Bridgestone Corporation and Subsidiaries
Years ended December 31, 2013, 2012, and 2011
2013 2012 2011 2013 / 2012 2013
Millions of yen Percent change Thousands of
U.S. dollars1
Net sales ¥3,568,091 ¥3,039,738 ¥3,024,356 17.4% $33,856,068
Overseas sales 2,893,251 2,343,546 2,330,154 23.5 27,452,804
Operating income 438,132 285,995 191,322 53.2 4,157,245
Net income 202,054 171,606 102,970 17.7 1,917,203
Total equity 21,862,964 1,417,348 1,165,672 31.4 17,676,857
Total assets23,577,045 3,039,799 2,677,344 17.7 33,941,029
Capital expenditure 274,862 245,644 201,390 11.9 2,608,046
Depreciation and amortization 176,180 155,066 158,044 13.6 1,671,696
Research and development costs 89,098 82,801 83,982 7.6 845,412
Net return on shareholders’ equity (ROE) (%) 12.7 13.7 9.1 — —
Net return on total assets (ROA) (%) 6.1 6.0 3.8 — —
Per Share Data Yen Percent change U.S. dollars1
Net income
Basic ¥ 258.10 ¥ 219.26 ¥ 131.56 17.7% $ 2.45
Diluted 257.81 219.10 131.50 17.7 2.45
Shareholders’ equity32,305.64 1,754.30 1,444.53 31.4 21.88
Cash dividends 57.00 32.00 22.00 78.1 0.54
1 Solely for the convenience of readers, the Japanese yen amounts in this annual report are translated into U.S. dollars at the rate of ¥105.39 to $1, the approximate year-end rate.
2 Certain overseas subsidiaries applied IAS 19 “Employee Benefits” (amended in June 16, 2011) from fiscal 2013.
As this change in accounting policy is applied retrospectively, the amount of total equity and total assets for 2012 reflect the retrospective application.
3 Shareholders’ equity is equity excluding stock acquisition rights and minority interests.
Note: Net sales exclude inter-segment transactions.
Operating Income /
Operating Income Margin
¥ billion / %
Net Income / ROE
¥ billion / %
Net Sales / Overseas Sales
¥ billion
70X30.5
2013
2012
2011
2010
3, 568.1
2,893.3
2,861.6
3,024.4
2,189.8
2,330.2
3,039.7 2,343.5
70X30.5
2013
2012
2011
2010 5.8
9.4
166.5
6.3 191.3
286.0
12.3%438.1
70X30.5
2013
2012
2011
2010
9.1
8.9
13.7
12.7%
171.6
103.0
98.9
202.1