Bridgestone 2003 Annual Report Download - page 2
Download and view the complete annual report
Please find page 2 of the 2003 Bridgestone annual report below. You can navigate through the pages in the report by either clicking on the pages listed below, or by using the keyword search tool below to find specific information within the annual report.-
 1
1 -
 2
2 -
 3
3 -
 4
4 -
 5
5 -
 6
6 -
 7
7 -
 8
8 -
 9
9 -
 10
10 -
 11
11 -
 12
12 -
 13
13 -
14
-
15
-
16
-
17
-
18
-
19
-
20
-
21
-
22
-
23
-
24
-
25
-
26
-
27
-
28
-
29
-
30
-
31
-
32
-
33
-
34
-
35
-
36
-
37
-
38
-
39
-
40
-
41
-
42
-
43
-
44
-
45
-
46
-
47
-
48
-
49
-
50
-
51
-
52
-
53
-
54
-
55
-
56
-
57
-
58
-
59
-
60
 |
 |

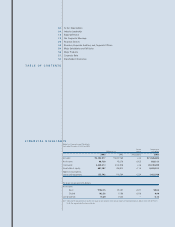
02 To Our Stakeholders
04 Industry Leadership
14 Regional Review
18 Our Corporate Moorings
20 Financial Section
53 Directors, Corporate Auditors, and Corporate Officers
54 Major Subsidiaries and Affiliates
56 Major Products
57 Corporate Data
57 Shareholder Information
FINANCIAL HIGHLIGHTS
Bridgestone Corporation and Subsidiaries
Years ended December 31, 2003 and 2002
Percent Thousands of
Millions of yen change U.S. dollars
2003 2002 2003/2002 2003
Net sales ¥2,303,917 ¥2,247,769 +2.5 $21,505,806
Net income 88,720 45,379 +95.5 828,153
Total assets 2,220,613 2,143,928 +3.6 20,728,209
Shareholders’ equity 887,987 796,013 +11.6 8,288,874
Additions to property,
plant and equipment 155,742 116,764 +33.4 1,453,766
Per share in yen and U.S. dollars
Net income
Basic ¥102.75 ¥51.97 +97.7 $0.96
Diluted 102.56 51.89 +97.6 0.96
Cash dividends 16.00 16.00 — 0.15
Note: Solely for the convenience of readers, the Japanese yen amounts in this annual report are translated into U.S. dollars at the rate of ¥107.13
to $1, the approximate fiscal year-end rate.
TABLE OF CONTENTS