Bridgestone 2002 Annual Report Download - page 2
Download and view the complete annual report
Please find page 2 of the 2002 Bridgestone annual report below. You can navigate through the pages in the report by either clicking on the pages listed below, or by using the keyword search tool below to find specific information within the annual report.-
 1
1 -
 2
2 -
 3
3 -
 4
4 -
 5
5 -
 6
6 -
 7
7 -
 8
8 -
 9
9 -
 10
10 -
 11
11 -
 12
12 -
 13
13 -
14
-
15
-
16
-
17
-
18
-
19
-
20
-
21
-
22
-
23
-
24
-
25
-
26
-
27
-
28
-
29
-
30
-
31
-
32
-
33
-
34
-
35
-
36
-
37
-
38
-
39
-
40
-
41
-
42
-
43
-
44
-
45
-
46
-
47
-
48
-
49
-
50
-
51
-
52
-
53
-
54
-
55
-
56
-
57
 |
 |

02 To Our Stakeholders
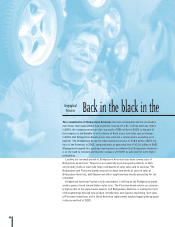
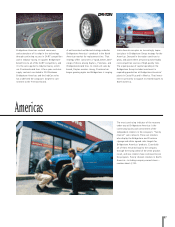
06 Back in the black in the Americas
08 Getting serious in Europe
10 Focusing on high-value segments
12 Taking a new look at globalization
14 Pioneering important new tire technologies
16 Building profitable business in new product sectors
18 Financial Section
51 Directors, Corporate Auditors and
Corporate Officers
52 Major Subsidiaries and Affiliates
54 Major Products
55 Corporate Data
55 Shareholder Information
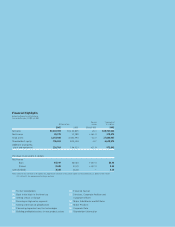
Financial Highlights
Bridgestone Corporation and Subsidiaries
Years ended December 31, 2002 and 2001
Percent Thousands of
Millions of yen change U.S. dollars
2002 2001 2002/2001 2002
Net sales ¥2,247,769 ¥2,133,825 +5.3 $18,747,031
Net income 45,379 17,389 +161.0 378,474
Total assets 2,143,928 2,443,793 –12.3 17,880,967
Shareholders’ equity 796,013 835,144 –4.7 6,638,974
Additions to property,
plant and equipment 116,764 104,313 +11.9 973,845
Per share in yen and U.S. dollars
Net income
Basic ¥51.97 ¥20.20 +157.3 $0.43
Diluted 51.89 20.19 +157.0 0.43
Cash dividends 16.00 16.00 — 0.13
Note:
Solely for the convenience of readers, the Japanese yen amounts in this annual report are translated into U.S. dollars at the rate of
¥119.90 to $1, the approximate fiscal year-end rate.