Blizzard 2003 Annual Report Download - page 16
Download and view the complete annual report
Please find page 16 of the 2003 Blizzard annual report below. You can navigate through the pages in the report by either clicking on the pages listed below, or by using the keyword search tool below to find specific information within the annual report.-
 1
1 -
2
-
3
-
4
-
5
-
 6
6 -
 7
7 -
 8
8 -
 9
9 -
 10
10 -
 11
11 -
 12
12 -
 13
13 -
 14
14 -
 15
15 -
 16
16 -
 17
17 -
 18
18 -
 19
19 -
 20
20 -
 21
21 -
 22
22 -
 23
23 -
 24
24 -
 25
25 -
 26
26 -
27
-
28
-
29
-
30
-
31
-
32
-
33
-
34
-
35
-
36
-
37
-
38
-
39
-
40
-
41
-
42
-
43
-
44
-
45
-
46
-
47
-
48
-
49
-
50
-
51
-
52
-
53
-
54
-
55
-
56
-
57
-
58
-
59
 |
 |

page 14
Management’s Discussion and Analysis of Financial Condition
and Results of Operations
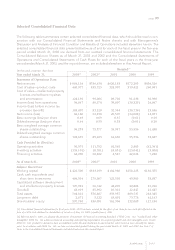
The following table sets forth certain consolidated statements of operations data for the periods indicated
as a percentage of total net revenues and also breaks down net revenues by territory and platform, as well
as operating income by business segment:
(In thousands)
Year ended March 31, 2003 2002 2001
Net revenues $864,116 100% $786,434 100% $620,183 100%
Costs and expenses:
Cost of sales—product costs 440,977 51 435,725 56 324,907 52
Cost of sales—software royalties
and amortization 79,194 9 58,892 7 49,864 8
Cost of sales—intellectual
property licenses 45,002 5 40,114 5 39,838 6
Product development 56,971 7 40,960 5 41,396 8
Sales and marketing 100,646 12 86,161 11 85,378 14
General and administrative 46,479 5 44,008 6 38,993 6
Total costs and expenses 769,269 89 705,860 90 580,376 94
Income from operations 94,847 11 80,574 10 39,807 6
Investment income, net 8,560 1 2,546 1 (7,263) (1)
Income before income tax provision 103,407 12 83,120 11 32,544 5
Income tax provision 37,227 4 30,882 4 12,037 2
Net income $ 66,180 8% $ 52,238 7% $ 20,507 3%
Net revenues by territory:
United States $432,261 50% $404,905 51% $352,893 57%
Europe 413,125 48 368,799 47 256,228 41
Other 18,730 2 12,730 2 11,062 2
Total net revenues $864,116 100% $786,434 100% $620,183 100%
Net revenues by segment/platform mix:
Publishing:
Console $466,116 76% $312,986 57% $278,486 60%
Hand-held 49,966 8 119,177 22 71,042 15
PC 99,893 16 117,345 21 116,534 25
Total publishing net revenues 615,975 71 549,508 70 466,062 75
Distribution:
Console 208,505 84 167,709 71 107,611 70
Hand-held 14,103 6 39,865 17 9,754 6
PC 25,533 10 29,352 12 36,756 24
Total distribution net revenues 248,141 29 236,926 30 154,121 25
Total net revenues $864,116 100% $786,434 100% $620,183 100%
Operating income by segment:
Publishing $ 79,139 9% $ 68,675 9% $ 35,687 5%
Distribution 15,708 2 11,899 1 4,120 1
Total operating income $ 94,847 11% $ 80,574 10% $ 39,807 6%